Why Raman Spectroscopy?
Overview
For identification and authentication purposes, the use of fundamental vibrational techniques is preferred to other techniques (e.g. chromatography) when possible, because results are easily reproducible, data contains information linked directly to physical and chemical properties, the limits of detection (and/or product deviations) are in general very good (detection of low level signal) and the speed of the analysis is fast. There are of course some elements that induce limitations on vibrational techniques that are well known and documented, such as area of analysis (normally a small area and how representative it is versus the whole process), level of sensitivity or the need to have primary samples to verify the technique, to mention only a few.
For many years, FTIR and NIR have been the most prevalent vibrational techniques at both, industrial and academic levels, but in the past two decades, Raman spectroscopy has been the faster-growing technique for material characterisation. FTIR and Raman spectroscopy are both defined as fingerprint techniques, while NIR is a technique that analyses the overtones of some vibrational modes. FTIR is without any doubt,
the technology leader in material characterisation, as it is very broadly accepted and used in most laboratories. The technology has evolved over the years from tedious sample preparation (old infamous KBr discs) to sophisticated microscopes and new sources of lights (QCL), but some of its limitations are well known too (limited penetration, limitations of sampling, limitations in portability or use of fibre probes, etc).
NIR has been broadly implemented in the last 50 years because the principle of instrumentation is simpler than for FTIR (after the work of Karl Norris 1). It has a great performance for quantitative analysis and it presents the prominent advantaged on sampling as mentioned before. Furthermore, the sampling area is quite large, which translates in good averaging of sample properties. Despite all those great features, NIR also displays some inherent problems: data are restricted to the identification of C-H, N-H, O-H[…] overtones, which means that the information obtained is limited to a certain number of chemicals and the spectrum obtained are very broad bands that are very difficult to interpret. In contrast, with FTIR or Raman, the bands correlate easily with functional groups and with the properties of the chemical.
A strong weakness in the NIR instruments is the requirement for calibration of the instruments and the chemometrics models required for its operation. These are generally unique to each process, material and instrument, which makes the task of model generation a long and complex one. An NIR calibration or NIR chemometrics model involves measuring many known samples with a given NIR instrument and the spectra values are then correlated with the reference values for that specific instrument. As a very general and simplified rule, the larger the number of samples (thousands instead of hundreds) in the model, the more precise this process will be (one should bear in mind that overfitting data can be negative). The task to generate good models also depends on the mathematical process selected to build the model. This implies that the same set of data, used by two different teams, can lead to different results unless there is a clear agreement on what methodology to use to cross-validate the data.
Raman is not a perfect tool either, since it has interference from the fluorescence process (the natural enemy of Raman spectroscopy, which can mask the signal of a given material), it is an inefficient tool in terms of signal generation (there are only a few photons per billion to generate the spectrum), and it can use any wavelength to create the spectrum (this is a positive thing, but those not familiar with spectroscopy often wrongly identify what wavelength needs to be used for their application).
However, the overall potential of the technique has consistently been recognised as one of the most powerful tools for material characterisation. The greatest points of the technique are:
- Data is obtained from where we focus the laser beam, allowing the signal to pass through clear containers
- No sample preparation to acquire the data
- Non-destructive* (*unless high wavelength and energy levels are used)
- Chemical specific fingerprinting/characterisation
- Fast data acquisition times
- Versatile, can be easily modified by adjusting the system via accessories, such as probes, microscopes, vial adaptors, etc.
Nowadays several key factors help to make these devices smaller, faster, more accurate, efficient, and more flexible than ever; some of the key elements being:
- Instrumentation size, miniaturisation of components, specific electronics and computing; it is now easy to find good offers on handheld Raman devices, they are limited on capability (they are not general use devices, but specific analysers), but very powerful for the task they have been designed for
- Development of laser technology – new generation of lasers which are more compact, with sharper lines, and more stable (prices are not decreasing as fast as their size yet, but will do in the long run)
- Incredible performance (and very reasonable price) of the silicon detector which is a key element for Raman devices; the advance on performance and optimisation of the Raman signal, improving detection limits and augmenting the usability of Raman units (including field analysis)
- Development of software and embedded/cloud computing, helping to shape the new generation of Raman devices, more capable of complex operation and often operating in autonomous mode
- Enlargement of databases – Raman technique requires reference samples for spectra interpretation and to run libraries. The development of the technique and the increase in use lead to creation of broader and accessible data that boost the capabilities of the technique.
In the past (still applicable today for research-grade systems) the Raman technique was restricted to use in laboratories and required advanced confocal microscopes, monochromatic lights (large gas lasers) and environmentally sensitive detectors. Laboratory conditions needed to be well controlled to avoid misalignments of the optical paths and their components. The newest generation of Raman devices is much more robust and applicable for use in industrial environments, portable or handheld devices.
These new generation products are designed more as analysers (dedicated tools for a given application) and they are somehow missing the flexibility that was so highly appreciated in bigger and more powerful Raman devices; with a portable device, users must select a single laser line and a specific configuration, which limits, to a certain extent, the flexibility of the technique.
Our new NEEGALA Raman series has been created to address these limitations. In a single compact device, we have combined 2 independent laser lines with complementary analytical capability in terms of resolution and spectral range, allowing us to offer features so far only restricted to research laboratories. The main advantage of using different laser sources is the ability to reduce the fluorescence background by choosing the laser excitation wavelength. Furthermore, some samples may respond differently to a particular wavelength (thermal, photochemical or resonance effects).
There are a few good portable devices available on the market, mostly based on 785nm lasers. This is a great laser line for many applications, however, when addressing samples that are potentially sensitive to NIR radiation, it is necessary to exercise great care to avoid damaging the sample (using even higher wavelength, like 1064, is a risky business). The selection of 785nm for Raman is a logical choice in these industrialised devices because it balances well the limited presence of fluorescence, a reasonable Raman signal (which is weak, as we operate in the NIR region – see table 1) and the capability of commonly used Si-based CCD detectors (figure 1) – the most sensitive in obtaining Raman signal. However, they operate at the edge of performance of these detectors and observe weak (or no) bands above 2800cm–1 (~1000nm), just before where bands like aliphatic and aromatic CH, NH or OH are displayed. This is a limitation that is accepted by many as the fingerprint region, lying between 200 – 2000 cm-1, but it is not ideal for all. For applications that require an expanded spectral range, lasers within the visual spectrum (i.e. 400 – 700nm) must be used.
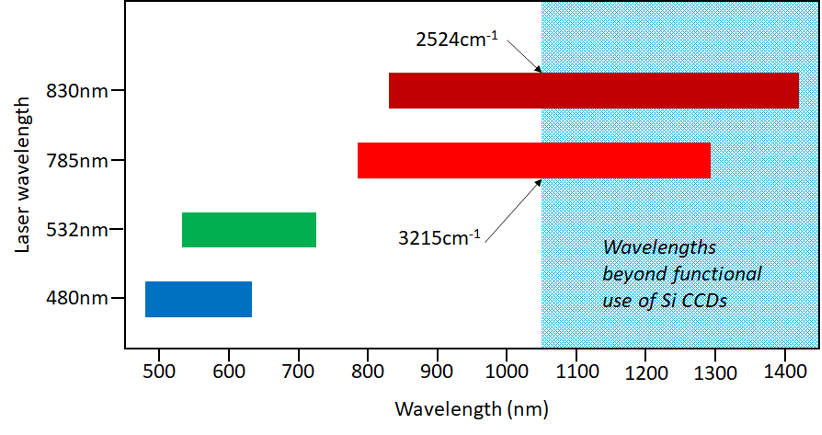
Figure 1. Range of CCD detector and window observed by a Si-based detector for 480, 532, 785, 830. Wavelength range required to view: 0 – 5000 cm-1 Raman shift for systems using different laser wavelengths. The last Raman shift value in the functional area of the Si CCD is displayed for the NIR lasers.
The Raman signal is directly proportional to the radiation intensity and the wavelength of radiation that impact the sample. If the radiation intensity is doubled, the Raman signal will also double. The radiation’s wavelength impact on signal intensity is inverted, which is to say that lower wavelengths produce more intense signals.

Table 1. The relative intensity of scatter acquired under the same conditions by a laser of wavelength in the green column (λa), compared to the wavelength in the blue row (λb), e.g. a system using an 830nm lasers generates a peak almost 9 times weaker than a system using a 480nm.

Equation 1. This equation calculates the factor of λa’s Raman scatter compared to λb’s Raman scatter.
A compact and portable Raman device, which offers more than a single configuration, is certainly more beneficial to those researchers who require a higher level of flexibility than standard modular or portable/handheld devices. It produces results that cannot be observed in single line devices (e.g. resonance effects), extends the spectral range (using visible line vs higher resolution via the NIR line) and allows better and more accurate control of laser power in sensitive samples. The use of visible wavelengths lasers that have less energy but produce stronger Raman signal that equivalent energy from a NIR laser, is preferred in sensitive samples. Furthermore, with 2 lines, one can compensate better if a sample presents some levels of fluorescence, (this is particularly powerful, e.g. the potential hyphenation of the Raman system with other techniques).
The NEEGALA Raman system is a fibre probe system, that can be used with the unique NEEGALA fibre probe that operates with both wavelengths. Alternatively, the system can be equipped with 2 independent fibre probes, doubling the unit’s analytical capabilities. Here are two examples of the benefits.
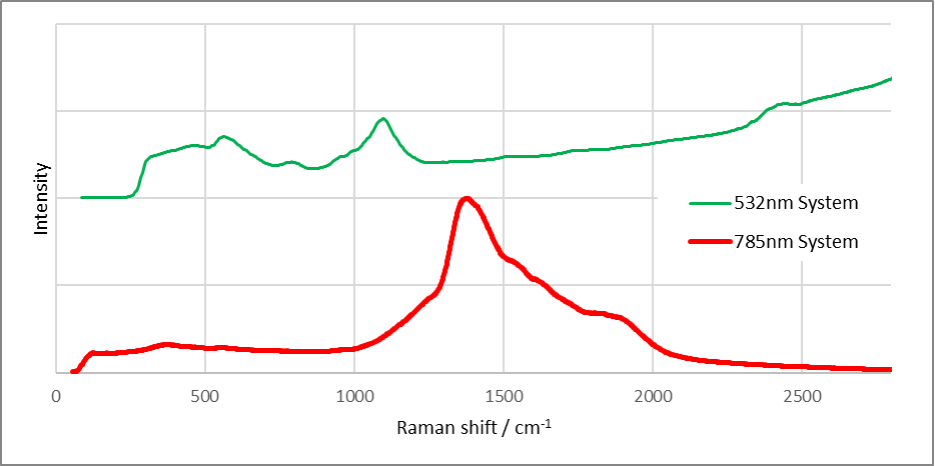
Figure 2. A graph showing the difference in response of a microscope glass slide when using a 532nm Raman system and a 785nm Raman system.
Glass is a great sample to show how photoluminescence appears at different wavelengths. The two graphs are the same sample analysed with two different wavelengths. The 785nm Raman spectrum shows a large photoluminescence peaking around 1400cm-1, whereas the 532nm Raman spectrum has Raman peaks below 1250cm-1 and a photoluminescence occurring at higher Raman shift.
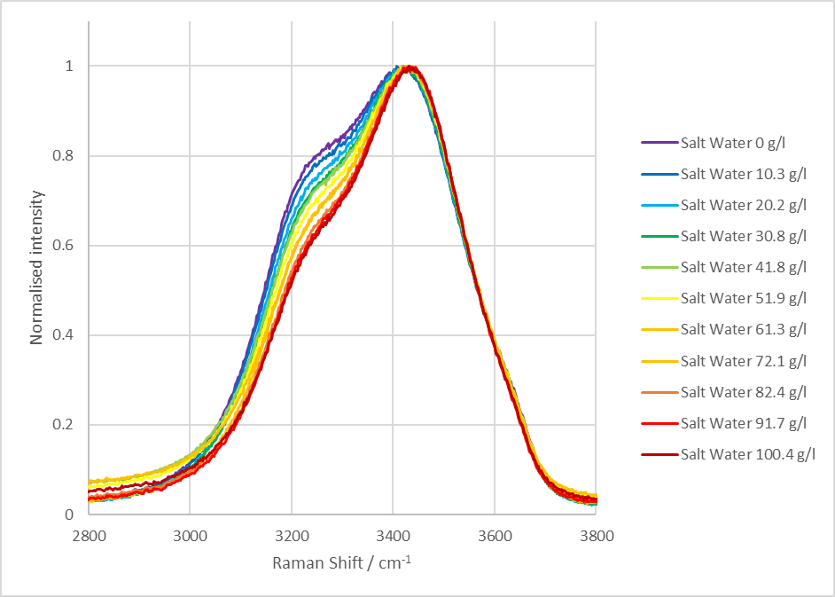
Figure 3. The impact of salt content in the Raman scattered by water.
A limitation of a 785nm system is the spectral range as shown in Figure 1. If you wish to look at hydrogen bonds such as water, you need to be able to view Raman shifts above those achievable in a 785nm system. A 532nm system does not have the same spectral limitation and in the NEEGALA can see up to ~4500cm-1.
Within this extra spectral range, you can detect the amount of salt in water by analysing changes in Raman peaks around 3400cm-1 for water. The salt changes the dipole moment, in essence making ions which are not normally detectable by Raman, detectable. The graph shows that as the salt content increases, the shoulder peak around 3250cm-1 decreases. Another notable effect of the increasing salty content is the peak at ~3400cm-1 shifts to higher Raman shift.
These are a couple of instances where the use of a NEEGALA system allows users to benefit from the wide and varied applicability of Raman spectroscopy without needing to buy multiple instruments. By having two laser lines in one instrument, a whole host of experiments open up to users, or merely the ability to conduct two experiments simultaneously and improve productivity. Whether you are looking to enhance your R&D department, or enhance the capabilities of your current analysis systems, you will find that versatility and flexibility definitely go hand in hand with the new generation of ELODIZ Raman systems.
For more information on our products, please contact us.