The Need of Harmonisation in Raman Spectroscopy?
CHARISMA – a European initiative to normalise industrial use of Raman – by Dr Enrique Lozano
Overview
Raman spectroscopy is a technique that involves scattering of monochromatic light, first observed by Sir C.V. Raman (i), after whom this technique is named. The development of this technology has been significant in recent years and has accelerated in the number of its applications and uses. Various user sectors, such as academic research/pharmaceutical/security, now understand the advantages of Raman spectroscopy over other techniques, particularly in the areas of speed of analysis, zero/low sample preparation and non-destructive examination, and have learnt to apply it with great proficiency. One of the aspects that Raman users appreciate the most is the richness of information in Raman spectrum, easy sampling, and versatile configurability; not forgetting its complementary correlation of information with other techniques like FTIR, NIR or fluorescence/luminescence.
Standardisation
Now let’s talk about the standardisation, an aspect very important in terms of instrument performance, validation, and spectral data formats. All manufacturers strive to make a product that meets given and expected specifications,
which include a definition of performance in terms of wavelength/wavenumber accuracy, repeatability, and scan-to-scan precision. These might be referenced to standards available from various sources (NIST, ASTM, IUPAC and others). The consolidation of the theoretical framework of terminology continues to be carried out due to industrial and technical development as well as globalisation. The need to periodically review and improve existing Raman standards is important to ensure that these incorporate the latest scientific research, practical experience, and best practices from the various fields of application. In this way, standards are used as valuable tools to facilitate communication, measurement, commerce and manufacturing. Moreover, standardisation is recognized and identified in EU projects under Horizon 2020 framework, as one of the innovation-support measures by bridging the gap between the research and the market.
The Characteristics of Raman
The number of companies offering Raman technology has impressively flourished in the past decade, from just a handful of companies capable to deliver Raman and high-end research grade microscope devices, to many now working with small handheld analysers, modular Raman or hyphenated devices with other effective techniques.
All Raman users require reproducibility and consistency in their results, but while some applications do require high precision, reproducibility and accuracy, others do not need such level of precision in their measurements; the precision is difficult to achieve in low resolution devices, and the key element of these applications is the consistency in their results (within a reasonable level of accuracy versus recognised standards).
All Raman devices, because of their experimental design and fabrication, exhibit a unit-to-unit variability – this can be due to subtle differences in alignment of optics, mounting of the spectrometer and detectors, efficiency of parts and a multitude of other small factors. These differences should be corrected to achieve repeatable, consistent, and interoperable Raman data.
Several parameters are the key elements to define how precise a peak will be in Raman. These are:
1) spectral resolution,
2) laser characteristics (mode along with bandwidth and spot size),
3) spectral range and the optical setup, and
4) type of spectrometer and detector.
A Raman system resolution is defined by the combination of the laser’s spectral linewidth and the spectrometer’s resolution (ii). Laser linewidth (measured typically as FHMW) and stability of the line (normally better that 0.1nm and commonly in pm) are key to deliver good and consistent data (iii). Another crucial factor is optical setup as well as the flexibility of Raman models to accommodate different sampling capabilities, however, this can also be a source of undefined deviations.
Raman devices can be divided into two main groups:
1) those based on fixed spectrometers and optical path, which are designed to perform a particular and dedicated task, like handheld and portable Raman. They are often associated with robustness (IP65 and above, military standards for roughness, etc) and reliability. These units normally have embedded manufacturer calibration, and they cannot be easily recalibrated in the field.
2) laboratory-based devices, with more flexibility in terms of configuration adjustments, involving the use of moving or motorised elements that introduce a source of uncertainty on the reproducibility of data. They need to be verified and recalibrated constantly to ensure precision and reproducibility.
Understanding the type of users and principles of Raman spectroscopy is fundamental to appreciate why there is not a strong consensus on what should be the best way to verify and to calibrate Raman devices. For the units included in the first group of devices – analysers – most of the configurations are pre-set at the time of use and users lack access privileges to calibrate the device (restricted to service technicians by the manufacturer). For the group of adjustable units, there are many variables and components that can be adjusted in the devices which often require expertise that average users do not have.
Raman vs Standards
Raman spectroscopy is a technique that intrinsically depends on how the data is obtained and processed to generate the spectrum. Each manufacturer interprets the Raman setup and the necessary corrections to generate a recognisable and useful Raman spectrum differently, and this is also driven by the type of final user, as Raman devices are targeted as befitting the potential customer.
It is acknowledged that no two Raman instruments, even of the same make and model, will produce the same raw data (iv) and only units that are fully calibrated and normalised can generate similar and reproducible data (v). For this, several standards and calibrations protocols have been accepted and implemented over the years. The principal factors that cover calibrations and normalisation of Raman data stand on two areas:
1) Calibrations/protocols/operations relevant to the x-axis – the following parameters and a good number of well understood protocols and proposed methods are available(vi):
- Spectrometer wavelength calibration – assigning pixels with an equivalent wavelength (in absolute nm);
- Elastic scattering, Raman 0’s, defined by the laser line (this can have a direct effect if the laser presents problems in stability of drift of the signal);
- Spectral dispersion over the observation window, this drives the valid spectral range, and so pixel resolution;
- Spectral resolution, defined as the minimum information needed to separate to adjacent peaks;
- Pixel adjustments, related to e.g., the elimination of hot pixels and the interpolation of data point;
- Other detector related corrections/adjustments (dark current, data packaging, modulation etc), pixel binning.
2) Calibrations/protocols/operations of the y-axis – these are related to the intensity of the signal acquired. They can be affected by several factors, such as the use of polarisers, the sampling geometry, volume of irradiation, depth of analysis, correction of the intensity of the Raman signal as a function of the dispersion, factors relative to the detector (integration time, saturation, gain, sensitivity, etc) but also by the presence of fluorescence or luminescence effects on the sample for the offset of the signal, noise introduced by the electronics, environmental light contamination and presence of cosmic rays.
Practically all manufacturers refer to the ASTM standards to verify and certify their products. The most referred standards being:
- ASTM E1840-96 (2014) Standard Guide for Spectrometer Calibration and Validation of the Raman shift axis;
- ASTM E2911-13 Standard Guide for Relative Intensity Correction of Raman Spectrometers;
- ASTM E2529-06 (2014) Guide for testing Raman resolution with 785nm excitation;
- ASTM E1683-02 (2014) Practice for testing the Performance of Scanning Raman Spectrometers.
The above standards are adequate and consistent, however, with the ever-evolving Raman technology and the need for information to remain correct and up to date, they don’t cover well the most popular new spectrometers (dispersive, modular, low resolution, new techniques) or consider some aspects like resonance effects. For example, ASTM E-1840 was produced mostly with and for FT-Raman devices, but this technique is a now declining, and refers to materials without known/characterized polymorphs. Since this standard was first developed, some of these materials containing known polymorphs, such as acetaminophen, have been discovered and published (vii). The other polymorphs may not be common, but they do exist. Nevertheless, after some minor updates the standards are still fully applicable nowadays.
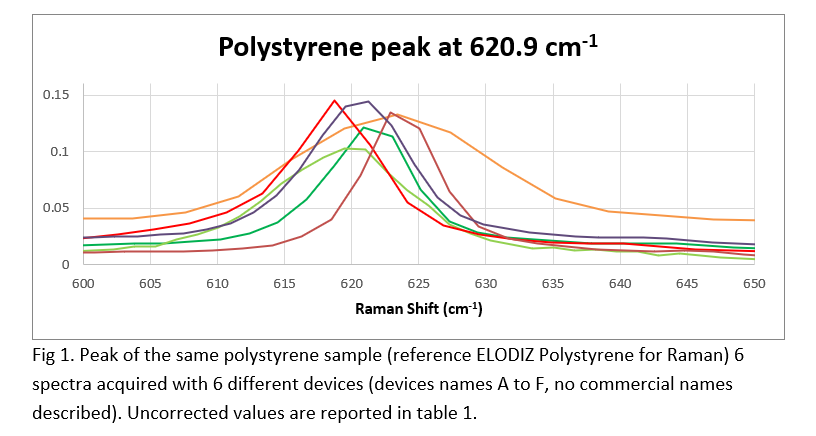
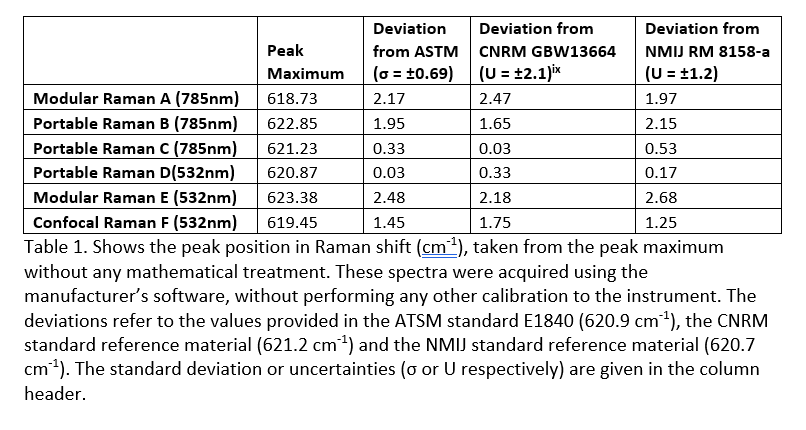
There is another problem that Raman spectroscopy still needs to face, which is quite a common one: how to achieve reliable data while comparing data from two different devices? As it can be observed in Fig 1, there are noticeable differences in the observed peaks, even if all the devices used do fulfil the standards. How to introduce corrections is often an aspect open to manufacturer’s discretion. What also does not help is that there is not an agreement or standards for reporting. As a result, many reported data fail to provide sufficient information about the way of sampling and data acquisition conditions or elements of data processing. This is clearly an obstruction for data reproducibility. Table 1 shows primary data (viii) obtained from a limited number of devices for polystyrene.
An example of manufacturers’ divergence is the different intensity correction procedures employed. Some manufactures do not offer this option, others have factory pre-calibrated units not easily reconfigured by the user and based on ASTM E2911-13 Standard Guide for Relative Intensity Correction of Raman Spectrometers, and SRM materials provided by NIST (standards 224X). In contrast, some manufacturers do offer intensity correction using external – NIST 224X- or internal standards – mostly white light source; even here, manufacturers have no agreement on the best practice. Nevertheless, it is generally common to find portable and handheld devices’ intensity calibrated with NIST 224X. Again, data reported often lacks the information if the intensity correction was used or not.
The main Pharmacopoeias have been fast in introducing or updating chapters regarding Raman devices mostly driven by the significant expansion of handheld devices in warehouses and mainly due to the problems on data consistency identified by the sector.
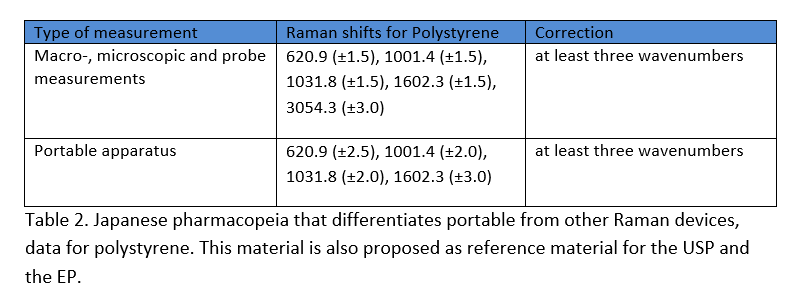
European and US-pharmacopeia have recently introduced changes in their chapter related to Raman spectroscopy. The European pharmacopeia, in chapter 2.2.48, refers to the basic principles of Raman spectroscopy and its major pharmaceutical-related applications. A general description of the equipment used in Raman spectroscopy (benchtop and handheld) and the spectrometer’s performance in terms of wavenumber calibration, relative intensity and spectra resolution are mentioned. All the above are directly correlated to already existing procedures, standards or reference materials like ASTM 1840 and NIST SRMs. Information and recommendation on qualitative and quantitative determination methods and sample preparation are also available, this is now public and released in Pharmeuropa 32.3. The United States Pharmacopeia (USP), refers to Raman apparatus and equipment in the USP 32 (chapters 197, 851 and 1120); unlike the European Pharmacopoeia, however, it provides a more detailed information and guidelines on calibration and verification of Raman spectrometers. The Pharmacopeia of the People’s Republic of China now includes a new section regarding “Guidelines for Raman Spectroscopy” and the Japanese Pharmacopoeia 17th Edition has also incorporated, since 2016, a note describing Raman Spectroscopy (Note 2.26) in Supplement II to JP17 New General Tests, with polystyrene as main reference.
There have been some appealing attempts of standardisation at the academic and institutional level, but they struggled to attract the correct level of attention from different manufacturers (x). A common approach, shared by many researchers, is acquiring the data and processing it outside the manufacturing environment. This approach works better with raw-data or primary data, i.e. data with minimised data-processing. Note, however, that this can reflect some corrections; pixel is irradiate and its intensity (in arbitrary units a.u.) includes corrections like, hot or dead pixels and data stitching. There are two types of data to consider here:
- primary data: data obtained after processing for correctness and to generate a complete and meaningful Raman spectrum (x and y axis correction, baseline subtraction, noise reduction, etc). This data defines processing to transform data: pixel to wavelength, Ramanshift calculations, background subtraction and intensity correction. We propose to use the new units “Arbitrary Units Corrected” (a.u.c.) to differentiate Raman data corrected for intensity, vs. arbitrary units (a.u.) for uncorrected data;
- secondary data: after postprocessing for analysis to provide a property to a set of data, including: intensity maps, deconvoluted curves, chemometrics modelling.
Conclusions and Solutions
Unfortunately, at this point in time, there is no universal acceptance of methods or protocols that guarantee the reproducibility, consistency, and stability of Raman data among devices; the accepted deviations between devices are still substantial, and this introduces a problem when introducing supranational regulations (like in the case of the EU). For this reason, the European Union is promoting the expansion of normalisation protocols in many analytical techniques; one of such projects is CHARISMA (GA #952921), which is the beneficiary of an EU grant working towards analysis and proposal of ways to normalise industrial use of Raman spectroscopy data. The collaboration with other international projects and initiatives – like VAMAS (xi), OYSTER (xii), EMCC (xiii), EMMC (xiv), EMMO (xv) and the NSC (xvi), with the development of materials and standards, or the development of CHADA (xvii) (CHAracterisation DAta file), targeting normalisation and clarifications of spectroscopy and its application to describe and characterise materials – is the correct route towards more precise and clearer Raman Spectroscopy.
For more information on our products, please contact us.
References
i – Raman C.V., Krishna’n K.S., A new type of secondary radiation. Nature. 1928; 121:501–8.
ii – remember the condition that the laser linewidth must be smaller than the spectrometer’s resolution.
iii – note that, for resolution purposes, a single mode laser is, by definition, more precise that multimode ones.
iv – understanding Raman raw data as the minimum data obtained from the spectrometer that has already some level of mathematical processing from the spectrometer -assigning pixels to wavelength- and laser line as defining 0 Raman shift- and other required processing to create a full Raman spectrum in Raman shift (cm-1) or nm.
v – Analyst, 2011, 136, 4232 www.rsc.org/analyst: Standardization of Raman spectra for transfer of spectral libraries across different instruments, Jason D. Rodriguez, Benjamin J. Westenberger, Lucinda F. Buhse and John F. Kauffman.
vi – Review of Existing standards, guides and Practices for Raman Spectroscopy, 2021 – paper accepted and pending publication in Applied Spectroscopy.
vii – Polymorphism of paracetamol: A comparative study on commercial paracetamol samples – P. Bashpa, K. Bijudas, et. al.; 1 April 2014, International Journal of Chemical Studies.
viii – Primary data refers to data as generated by the device, using the minimal processing data to generate the Raman spectrum; it is a uncorrected as can be.
ix – The standards uses 621.1 cm-1 Raman Shift as centre of the peak, instead of 620.9 as the other standards.
x – Comparability of Raman Spectroscopic Configurations: A Large Scale Cross-Laboratory Study; Analytical Chemistry 2020 92 (24), 15745-15756.
xi – VAMAS: http://www.vamas.org/
xii – OYSTER: https://www.oyster-project.eu/wp-content/uploads/2018/03/Oyster-project-leaflet-v1.7.pdf
xiii – EMCC: European Material Characterization Council, http://www.characterisation.eu/
xiv – EMMC: European Materials Modelling Council, https://emmc.info/
xv – EMMO: https://emmc.info/emmo-info/
xvi – NSC: https://www.nanosafetycluster.eu/
xvii – CHADA: https://zenodo.org/record/2636609#.YYezXdnML0p