Raman Spectroscopy for Gemstones: The challenge of selecting the correct laser for Identification and Authentication.
By Dr Enrique Lozano and Mr Enrico Kaluwaduge Don
Accurate gemstone identification is required for scientific gemmology, commercial integrity, and the stewardship of cultural heritage. In the gem trade, determinations of species, variety, and potential treatment status underpin valuation, disclosure, and consumer confidence, while in museum and conservation contexts they inform provenance research, appropriate handling, and long-term preservation strategies. As high-value stones increasingly circulate across international supply chains and appear in historically significant objects, identification procedures are expected to be both reliable and compatible with delicate, finished, or mounted materials.
Conventional gemmological methods continue to provide essential screening information, yet their diagnostic certainty may be constrained under contemporary conditions. Refractometry and birefringence observations can be limited by surface condition, mounting geometry, and the availability of suitably oriented facets, while specific gravity measurements may be impractical for set stones and can be confounded by composite constructions. Polarised light microscopy and inclusion analysis may also yield ambiguous outcomes when inclusions are sparse, when optical properties overlap across species, or when modern treatments and synthetic growth techniques produce internal features designed to resemble those of natural gems. As a result, reliance on traditional optical and physical tests alone may be insufficient for definitive identification, particularly when visually or chemically related materials are encountered.
Raman spectroscopy is well suited to these constraints, as it provides a direct, structure-sensitive “molecular fingerprint” derived from vibrational modes of the crystal lattice and molecular bonds. Spectral peak positions and relative intensities are governed by composition and crystallographic arrangement, enabling discrimination between minerals that may appear similar by colour or transparency. Importantly, Raman analysis is non-destructive and typically requires no sample preparation, allowing spectra to be acquired from rough crystals, faceted gemstones, and stones mounted in finished jewellery with minimal handling. When supported by curated reference libraries, Raman spectra can be interpreted through objective peak matching, thereby reducing dependence on subjective visual judgement. Raman spectroscopy is a powerful complement to other gemmological analytical techniques and is often the preferred solution for rapid, reliable identification. However, certain subjective characteristics remain beyond the scope of the technique. For example, gemstone valuation may depend strongly on colour quality; in blue sapphires, a slight violet secondary hue is generally desirable, whereas a greenish secondary hue may significantly reduce value. As a result, scientific expertise and professional gemmological assessment remain essential alongside instrumental analysis.
The choice of excitation wavelength is critical in gemmological Raman work because many gemstones and treatments exhibit strong fluorescence under visible excitation that can overwhelm weak Raman scattering. Near infrared excitation at 785 nm is therefore advantageous in many practical scenarios because fluorescence backgrounds are commonly reduced relative to those generated by shorter wavelength sources such as 532 nm, improving the recoverability of diagnostic Raman bands and enhancing signal interpretability for coloured or inclusion rich specimens. In the present study, a blind experimental format was implemented to test whether Raman spectroscopy alone could enable accurate identification of ten gemstone specimens of unknown identity. Spectra were collected using an ELODIZ NEEGALA™ Raman spectrometer and were first matched against a curated internal reference spectral database using the proprietary spectral search library. To further validate the identifications, the resulting best matches were subsequently cross checked against the independent RRUFF Raman database, with final identifications derived solely from spectral features and without access to any prior information regarding the specimens.
In dispersive Raman spectroscopy, a common rule of thumb is that increasing the excitation wavelength reduces fluorescence background and therefore improves spectral readability. This is often true, but gemstones do not always behave according to such a simple a rule. Some specimens still show strong luminescent background under 785 nm, while others yield clearer and more chemically informative Raman features at 532 nm. For practical gem testing, the analytical advantage lies not in a single “best” wavelength but in the ability to compare both and choose the most interpretable spectrum for each stone.
Materials and Methods
For this reason, the present application note should be viewed primarily as a demonstration of a dual-laser Raman strategy in gemmology. The sample identifications provide the practical framework, but the central message is that wavelength flexibility improves performance whenever fluorescence, Raman efficiency, or spectral detail varies from one gemstone to another.
Instrumentation
Raman measurements were performed using the ELODIZ NEEGALA™ 532 nm and 785 nm Raman system equipped with the ELODIZ NEEGALA PROBE for gemstone analysis. Data acquisition and export were conducted in the SOMPAS software environment using controlled acquisition parameters, including integration time, averaging, and laser power. For traceable reporting and consistent handling of datasets, exported files contained the complete Raman shift axis together with the associated intensity traces (including raw signal and the SOMPAS background-subtracted output), enabling direct comparison within the subsequent matching workflow.
Sample Set
A total of ten gemstone specimens were analysed under a blind format, such that the identity of each specimen was unknown prior to measurement. The stones varied in colour, cut geometry, and apparent size, representing a practical range of gem materials as encountered in routine identification contexts. All specimens were unmounted, and no pre-screening (e.g., refractive index, specific gravity, or microscopic assessment) was performed before Raman acquisition, so that the identifications could be attributed solely to Raman spectral information and the reference-search procedure.
Spectral Acquisition
Each gemstone specimen was placed on a dedicated sample holder to stabilise the stone and to maintain a consistent measurement geometry. Orientation was adjusted so that the table facet, or the nearest available flat facet, faced the probe. Prior to each acquisition, the probe focus was manually optimised at the gemstone surface to maximise Raman signal quality and reduce background contribution. Spectra were acquired using variable integration times to account for differences in gemstone signal intensity. For all measurements, the number of accumulations was fixed at 10 to improve the signal-to-noise ratio and produce spectra that were smooth and easy to interpret. Peak assessment was performed using the spectra exported from ELODIZ SOMPAS Software; no additional baseline correction or smoothing was applied prior to identification.
Identification Protocol
Identification was carried out through spectral searching of each measured spectrum against the curated online reference library hosted at https://data.elodiz.com. (ELODIZ LENS is a free online software tool for the data visualisation and correction of Raman data, including a free library search). Following the initial identification using the internal spectral library, the proposed matches were then cross-checked against the independent RRUFF Raman database for additional confirmation. For reporting, a match was considered reliable when at least two key peaks aligned closely between the measured spectrum and the top library result, using a tolerance of ±3 cm⁻¹. The final identification was assigned based on the best overall match supported by agreement between both the internal library and the RRUFF reference spectra.
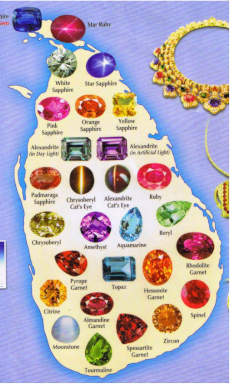
Sri Lankan Gems
Figure 1 © image Ministry of Mahaweli Development and Environment alongside the National Gem and Jewellery Authority (NGJA) of Sri Lanka. [1]
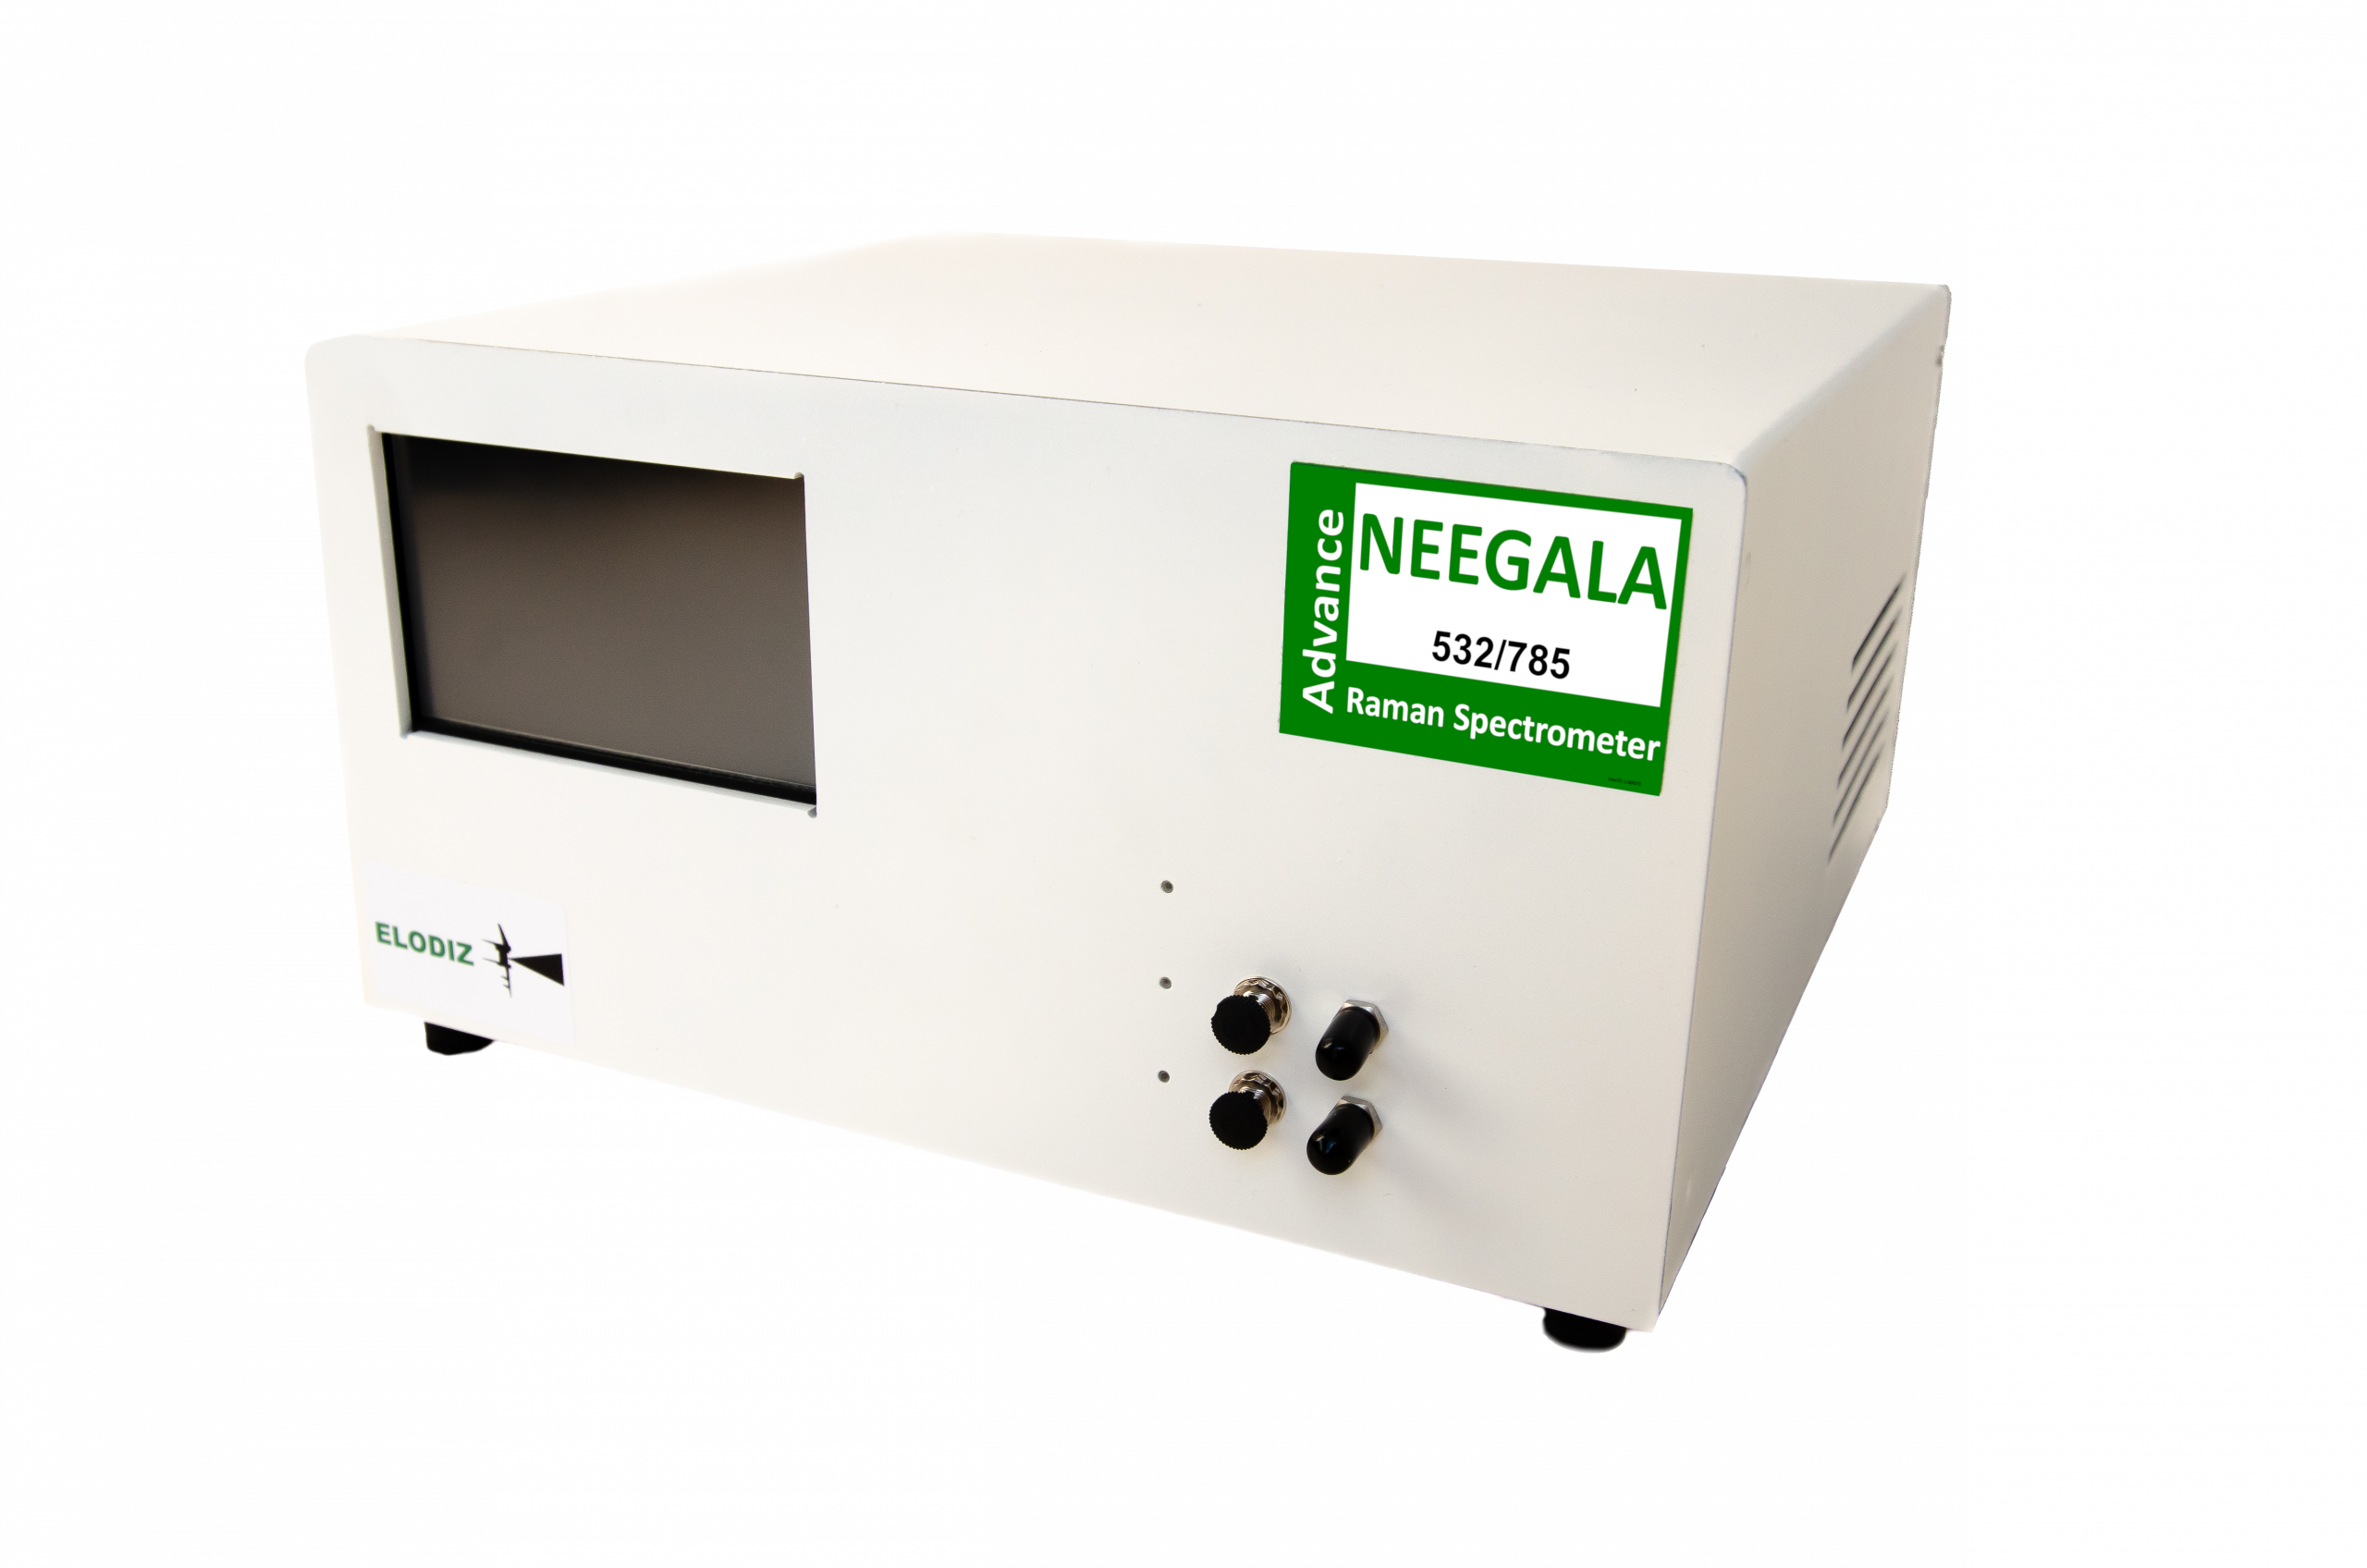
ELODIZ NEEGALA™
Figure 2: Image of ELODIZ NEEGALA™
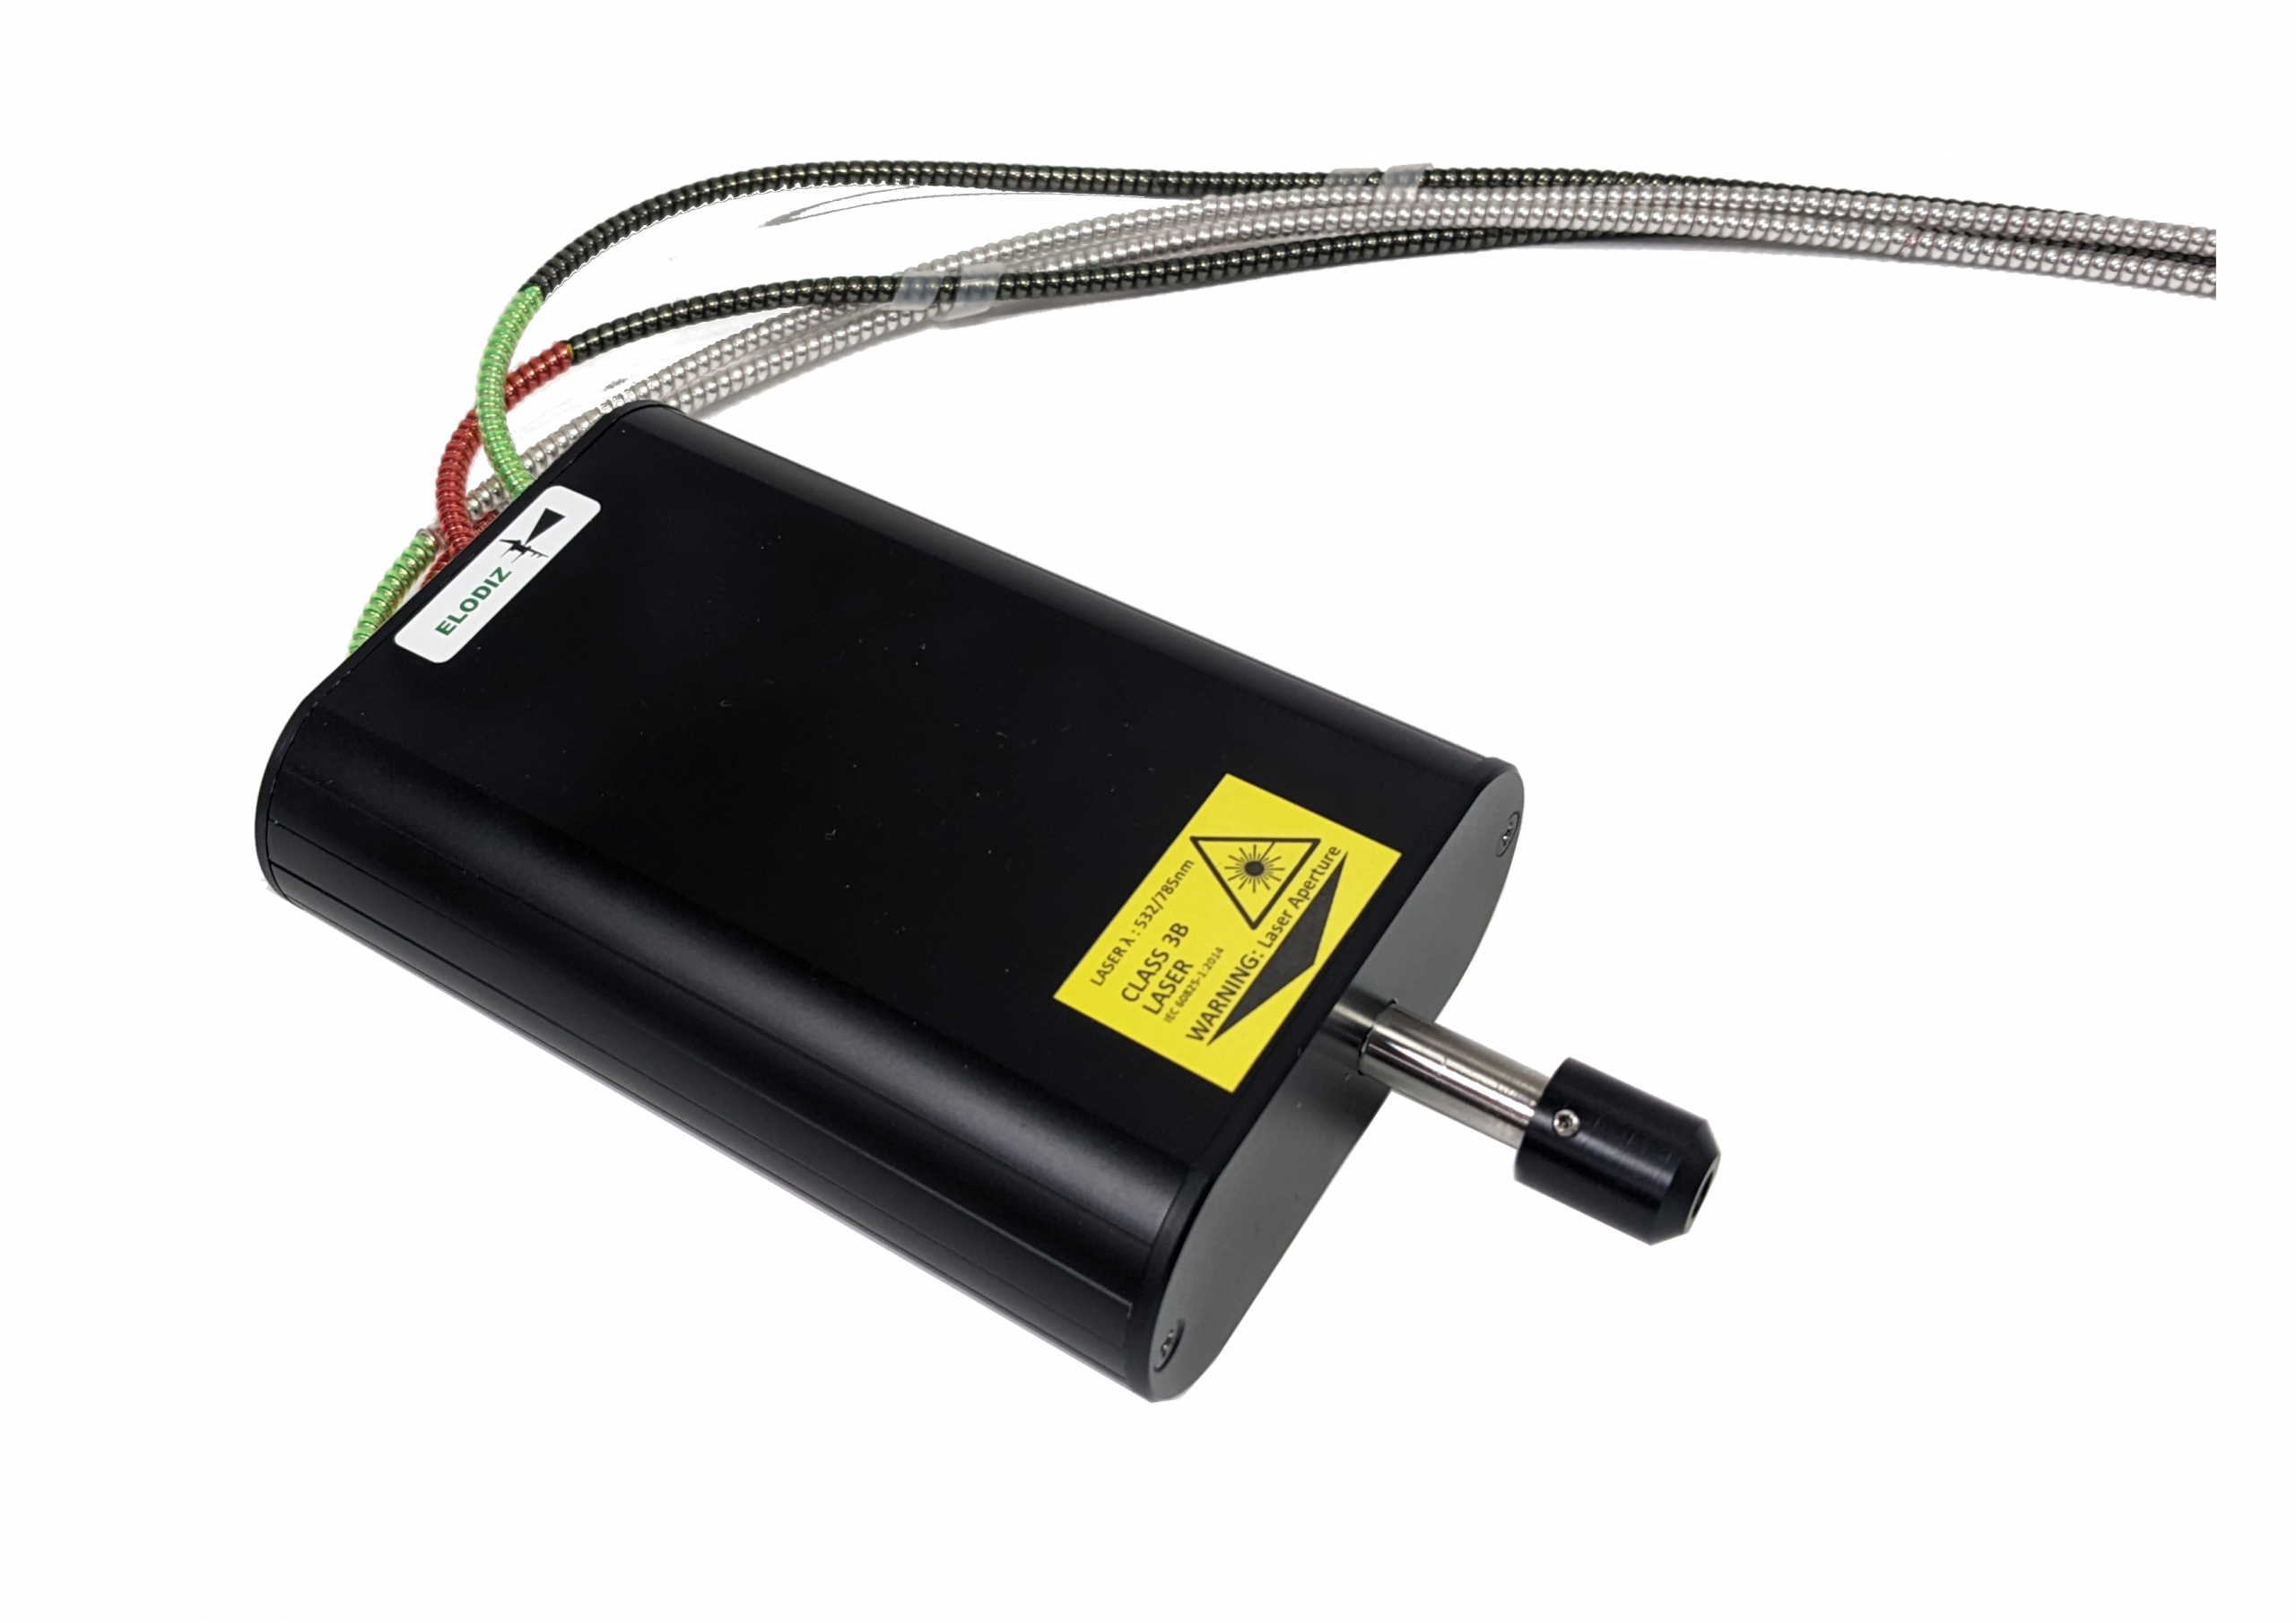
ELODIZ NEEGALA™ PROBE
Figure 3: Image of Dual Wavelength (532 and 785) ELODIZ NEEGALA™ PROBE
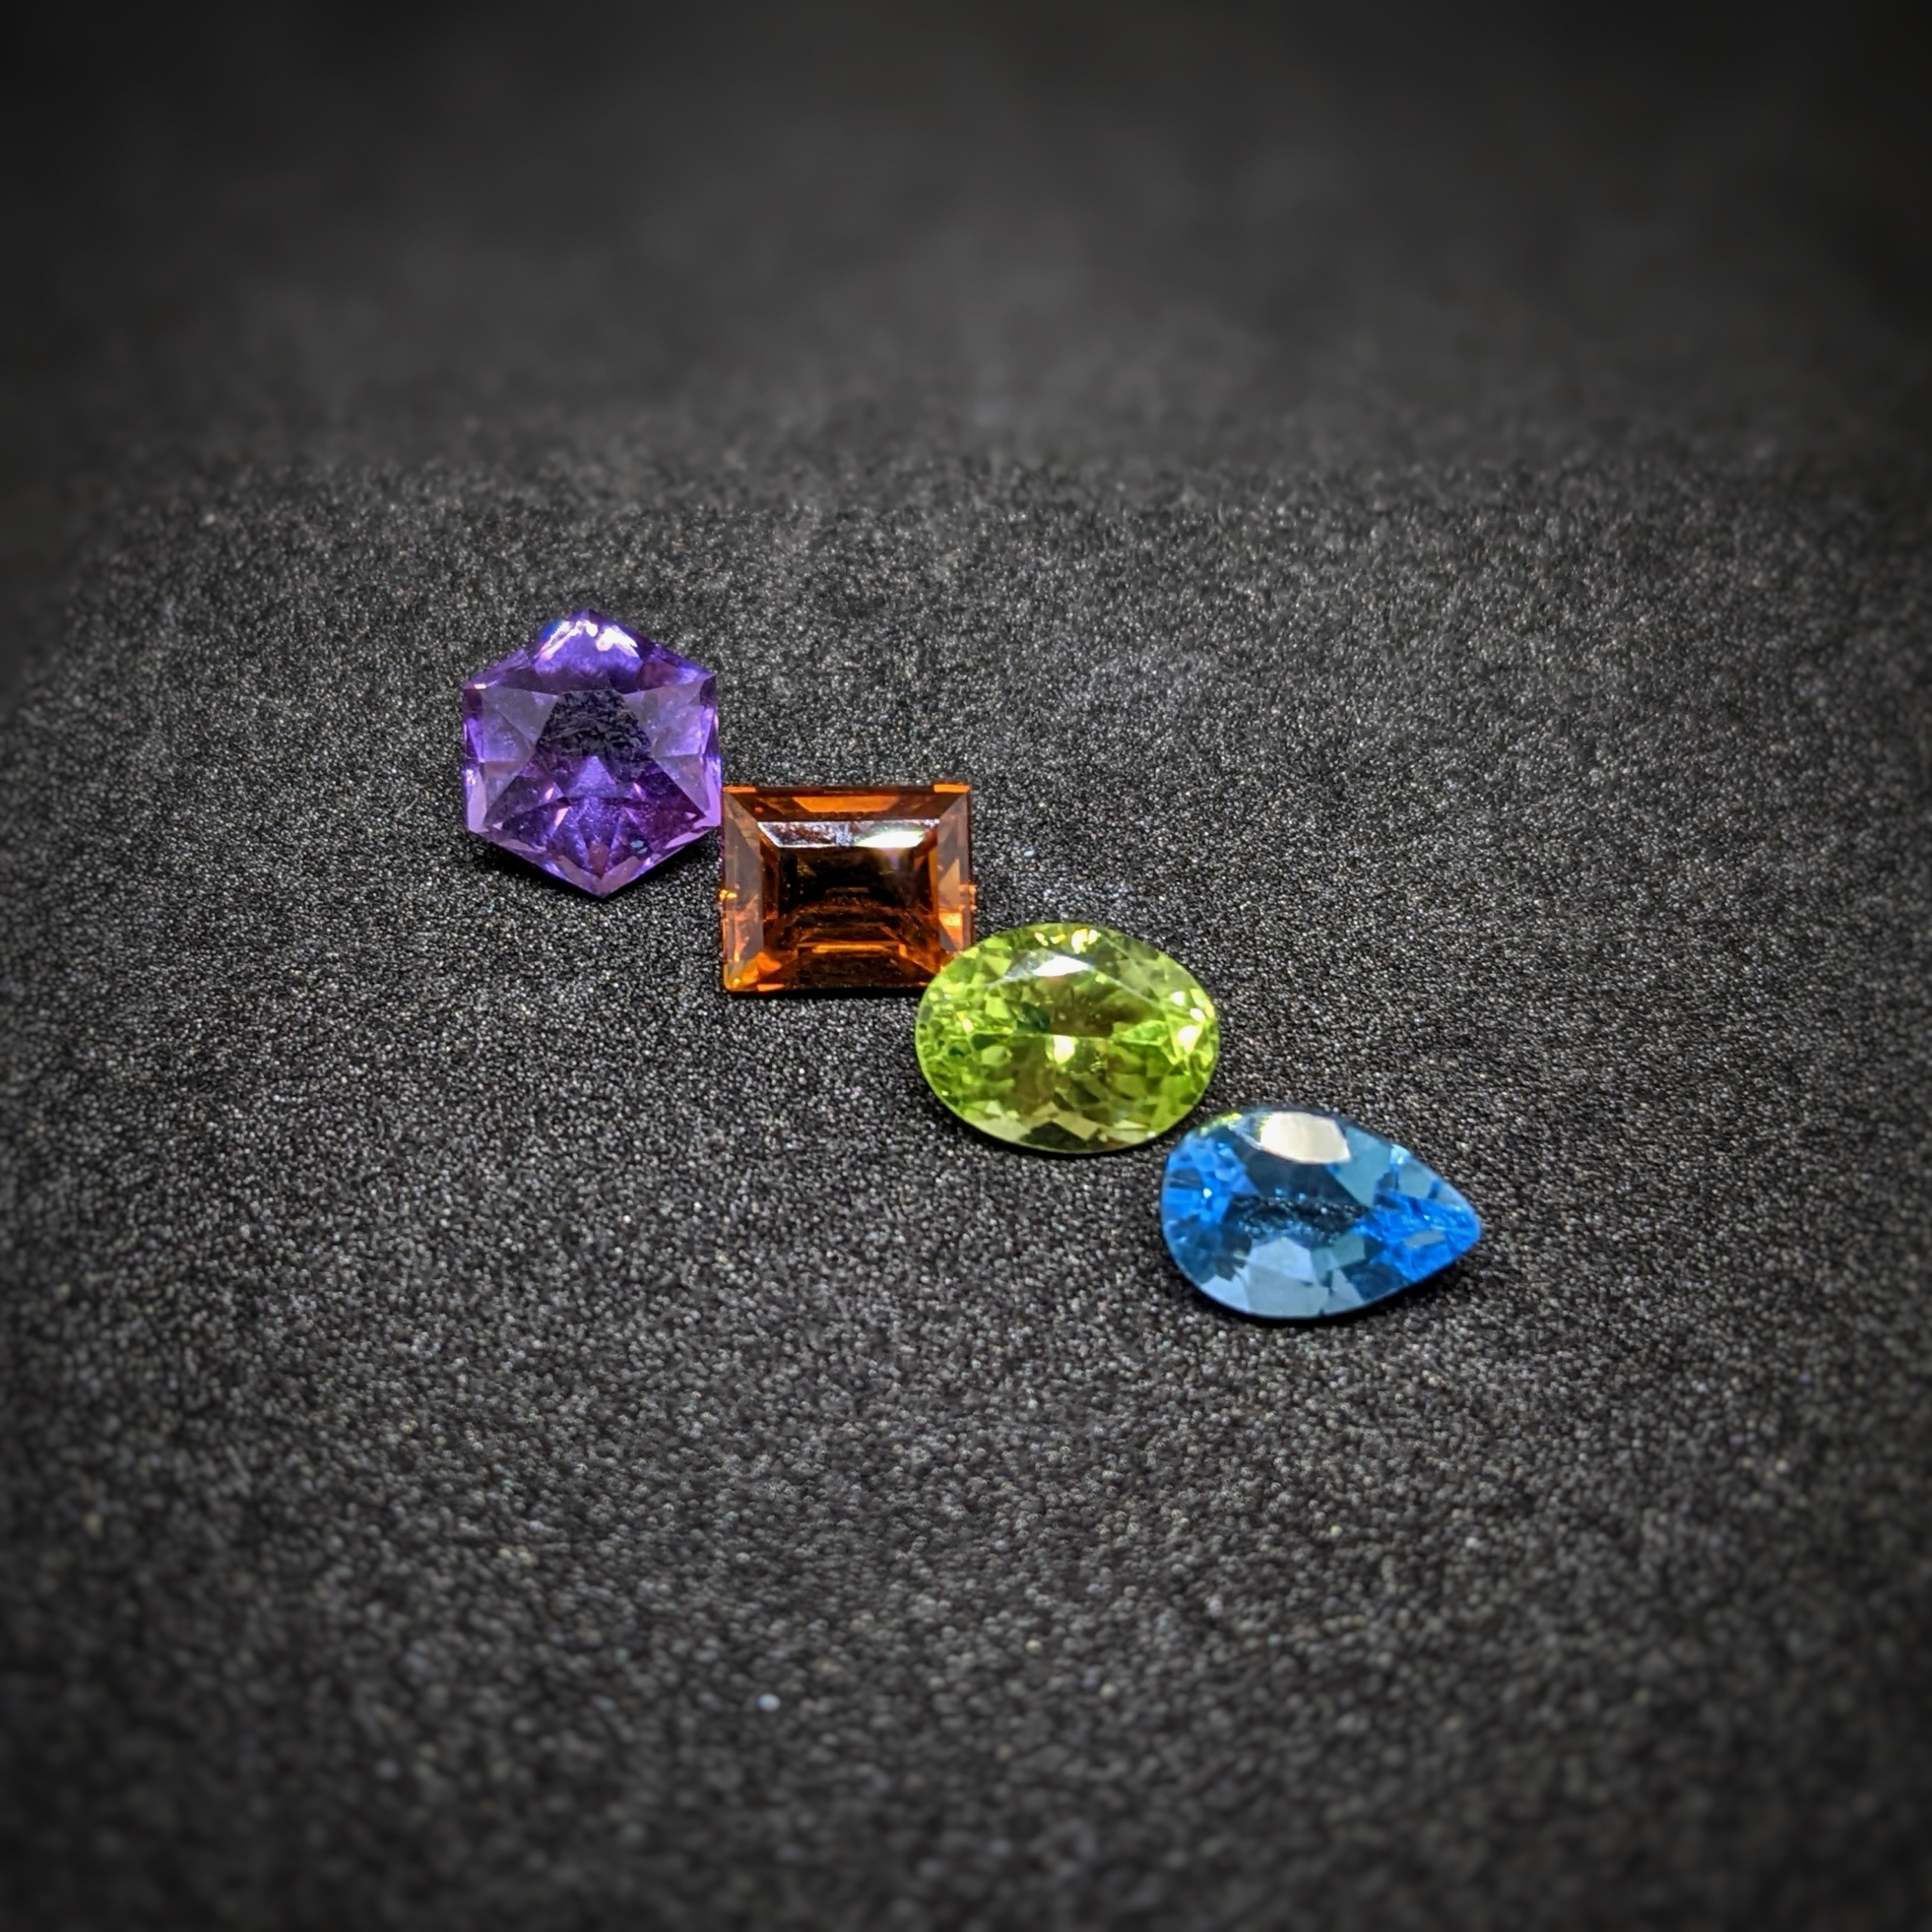
Gems from the study
Figure 4: Image of four of the Gems used in the application note.
| Sample | Raman peaks observed (cm⁻¹) | Identified mineral (with chemical formula) | Spectrum |
|---|---|---|---|
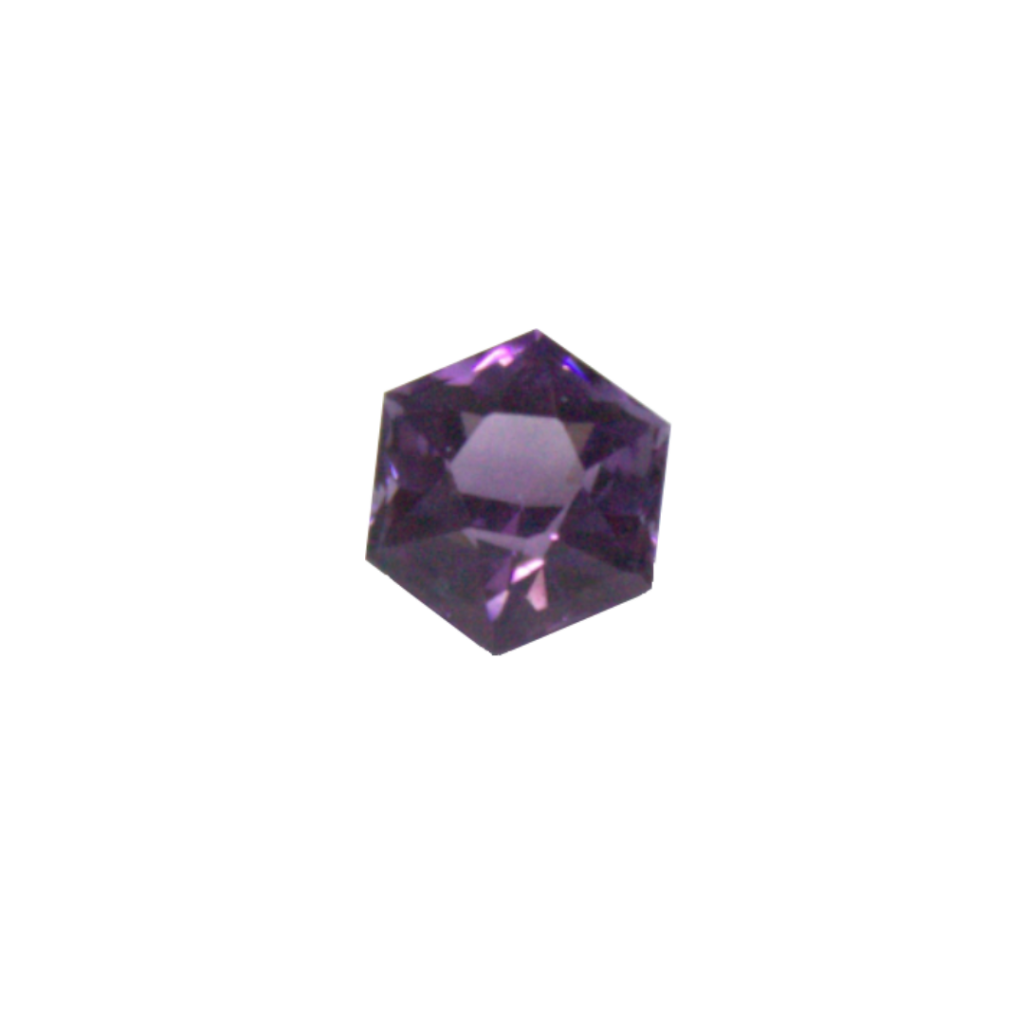 |
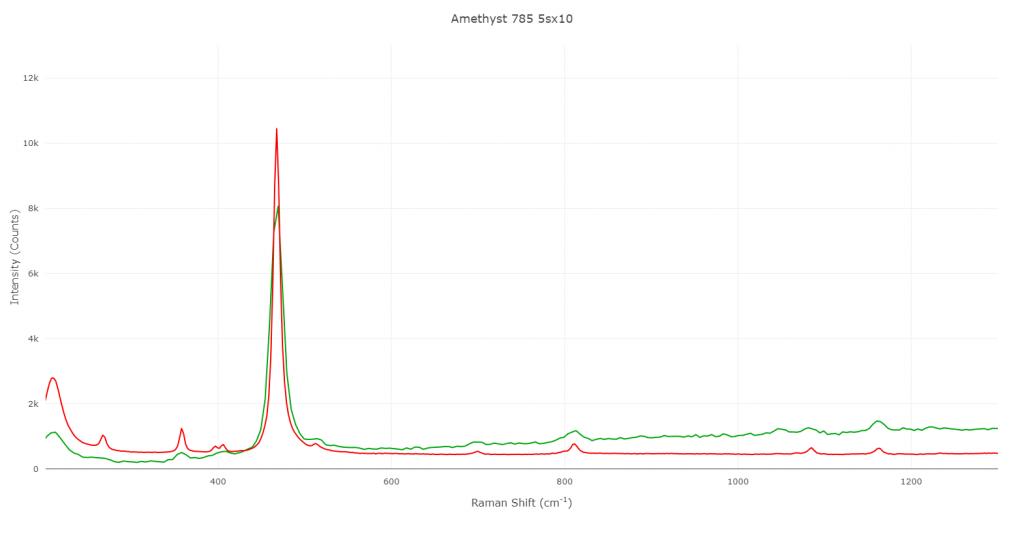
131, 210, 266, 357, 467.2, 811. | Amethyst
(SiO₂, α-quartz) |
 |
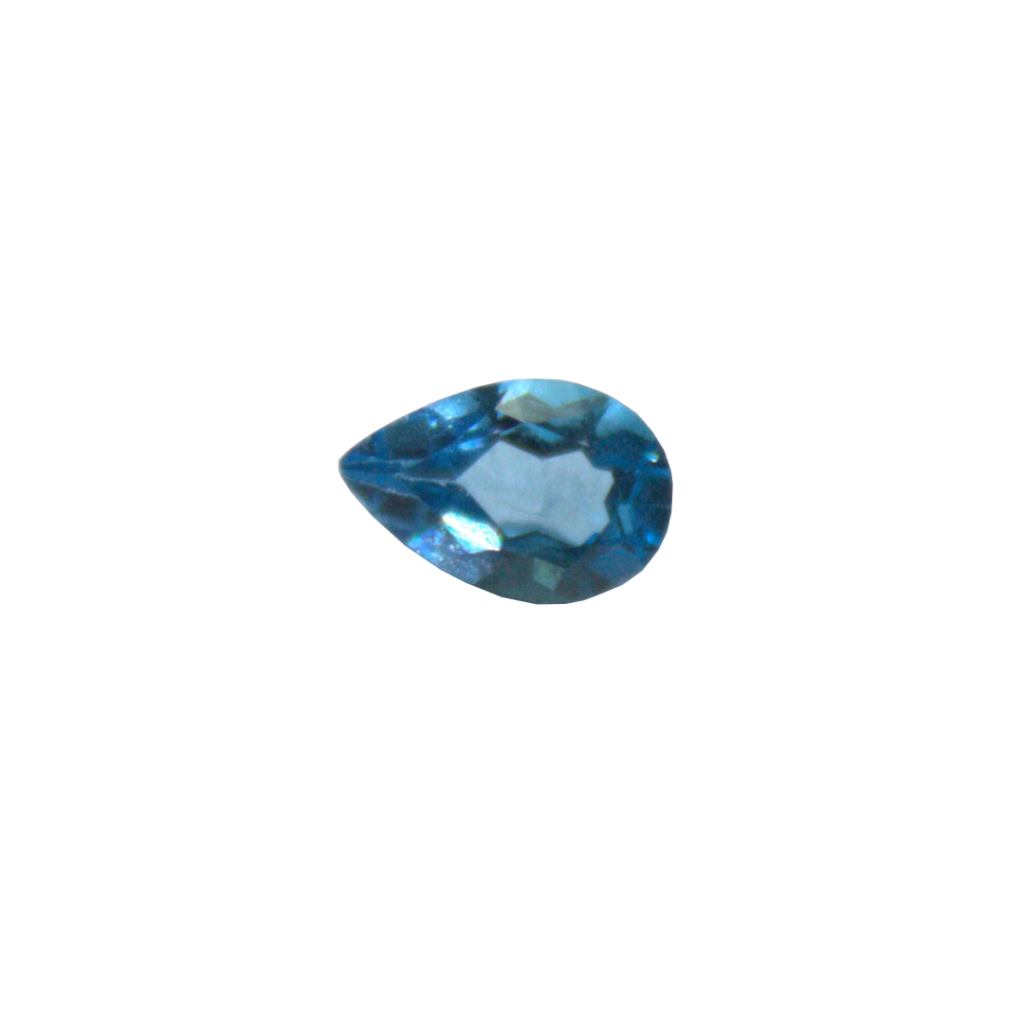 |
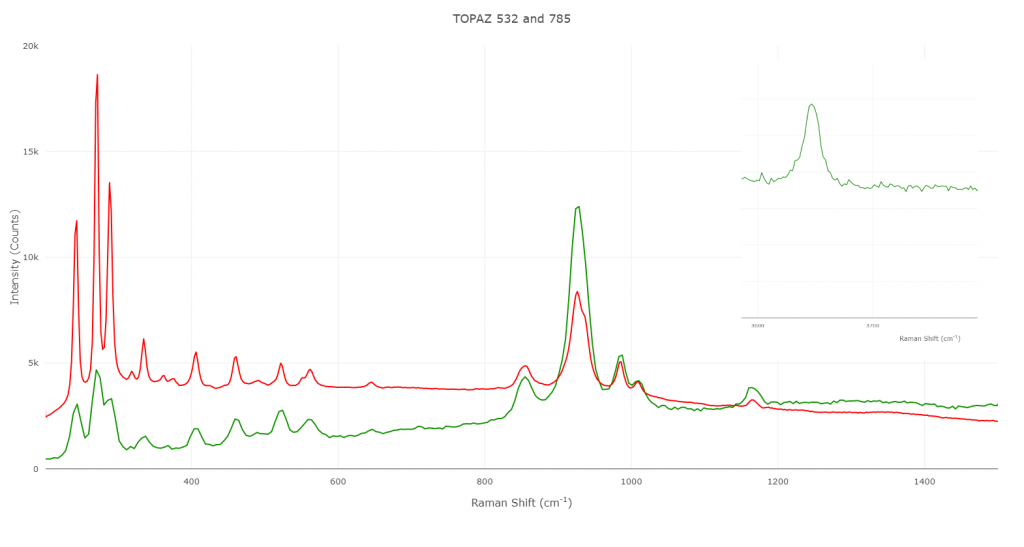
242, 271, 288, 334, 406, 460, 521, 926, 3646, 4071, 4157. | Topaz
(Al₂SiO₄(F,OH)₂) |
 |
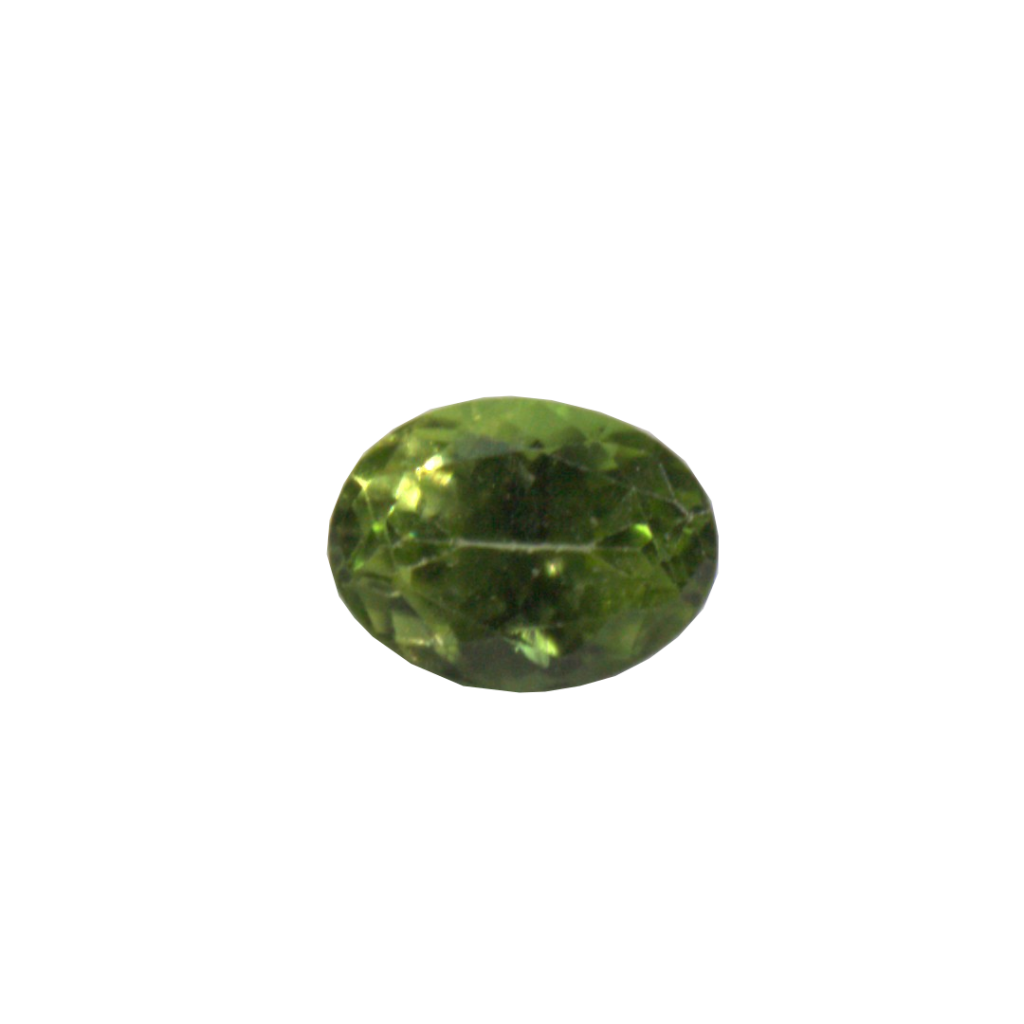 |
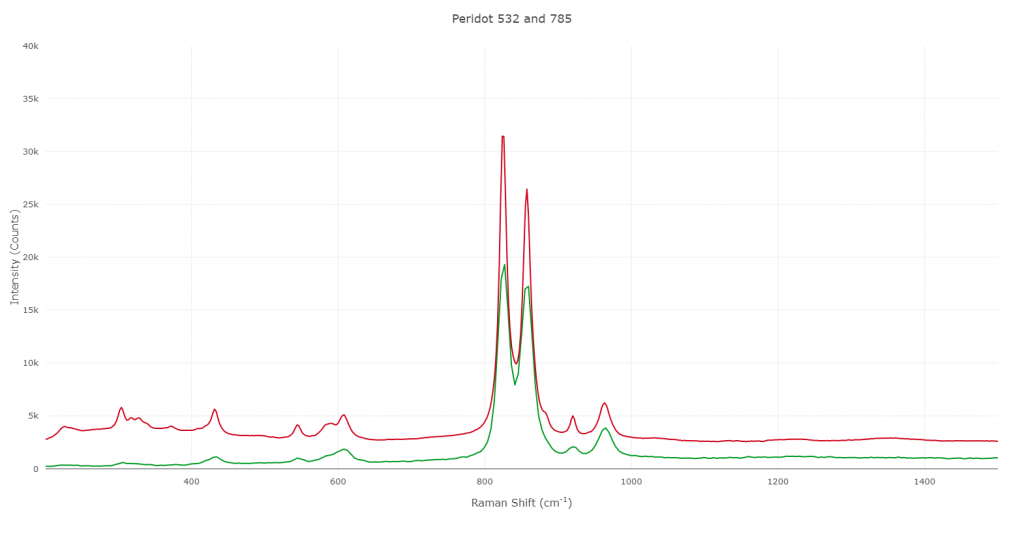
546, 608, 827, 857, 920, 963. | Peridot
(Mg₂SiO₄) |
 |
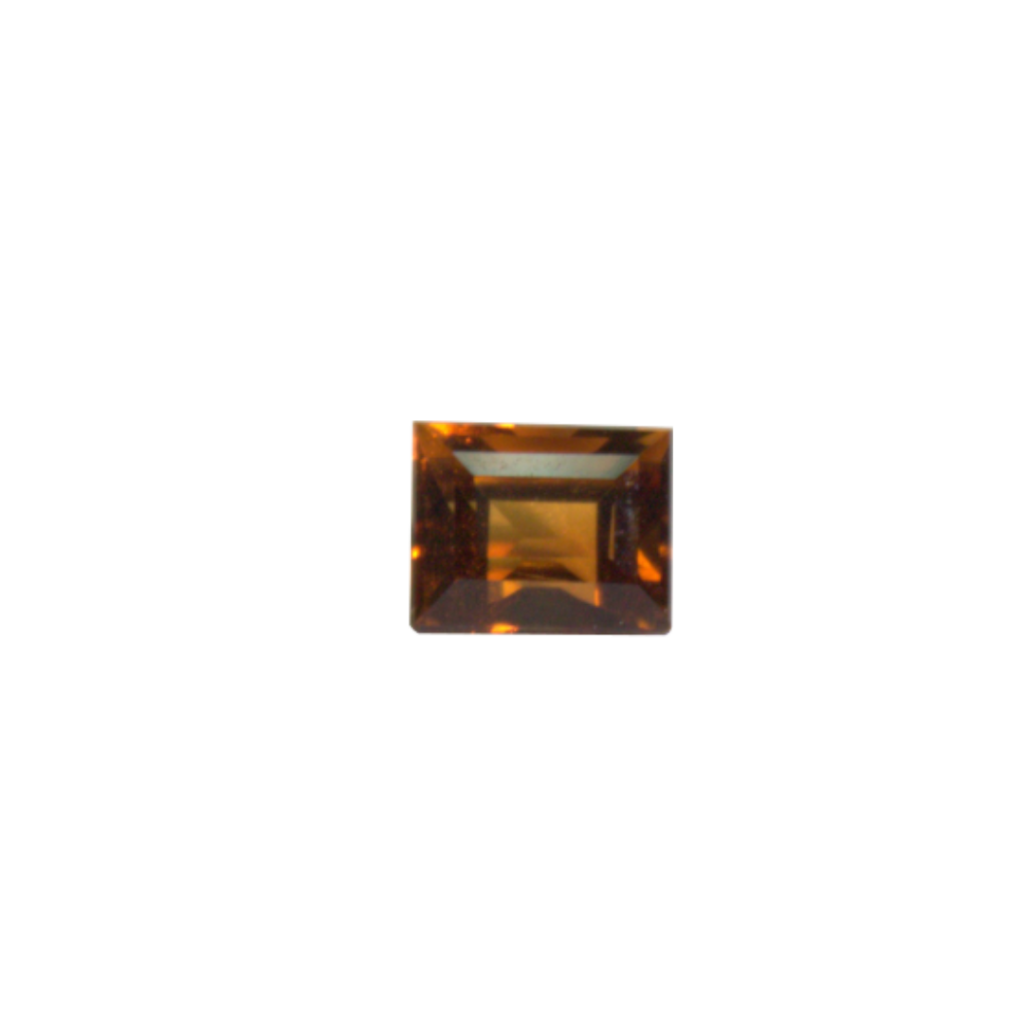 |
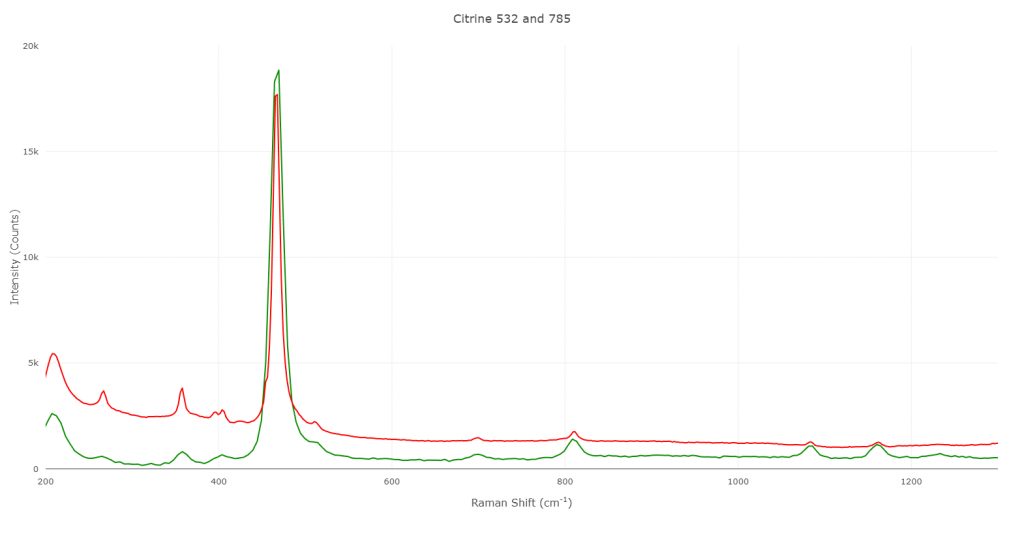
207, 266, 357, 467, 811. | Citrine
(SiO₂, α-quartz) |
 |
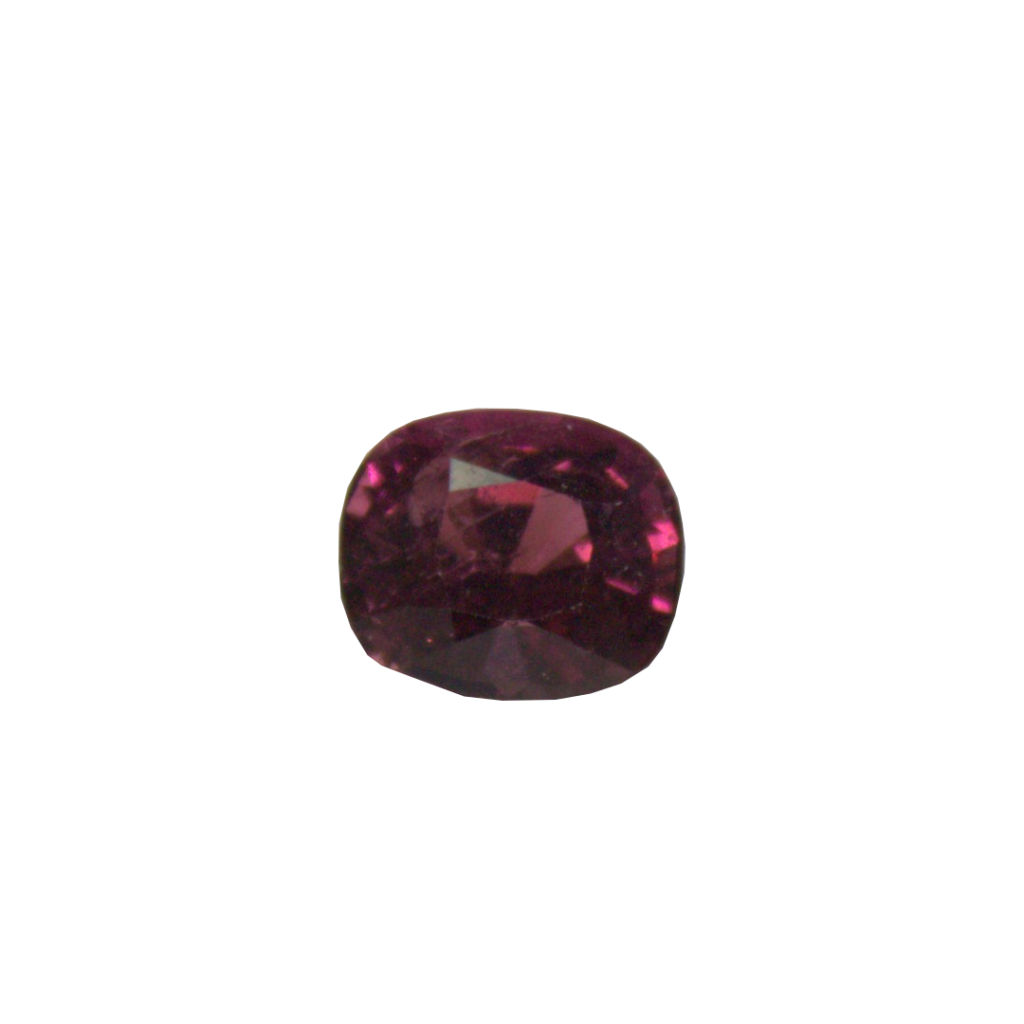 |
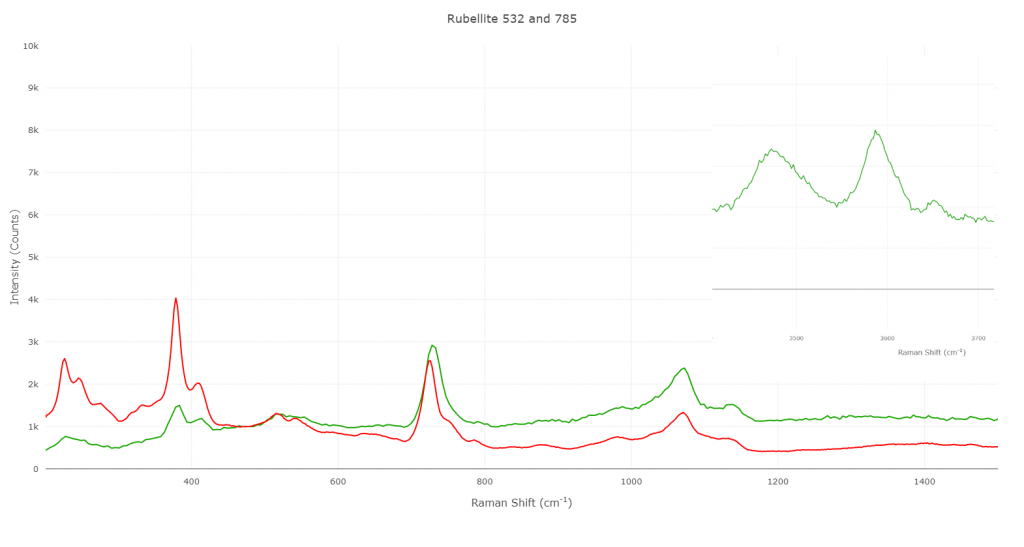
226, 245, 378, 410, 514, 725, 1070, 3472, 3586, 3650. | Rubellite
(Na(Li,Al)₃Al₆(BO₃)₃Si₆O₁₈(OH)₄) |
 |
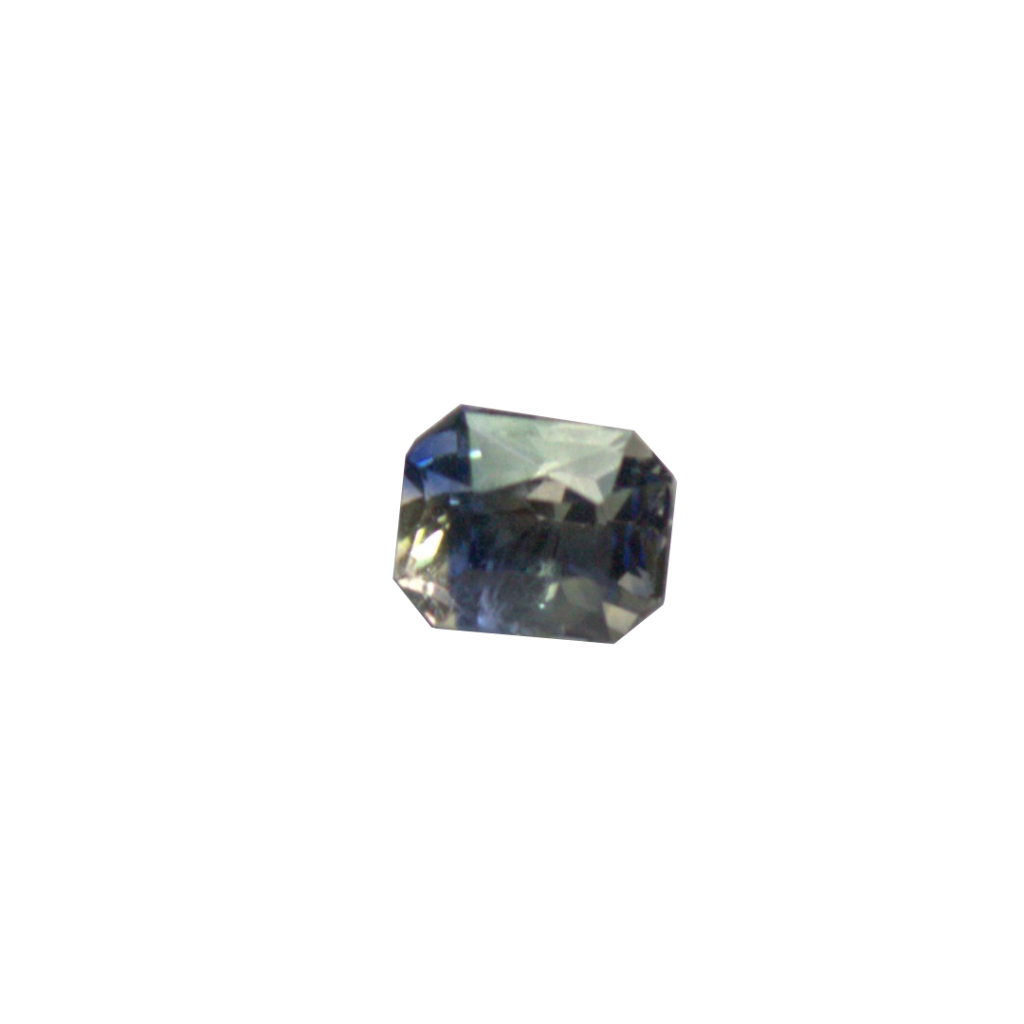 |
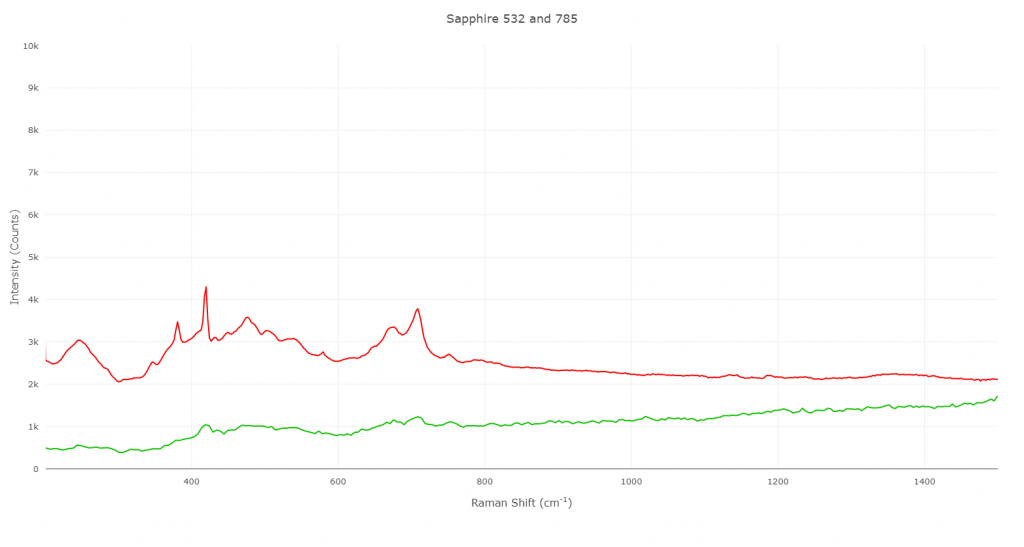
380, 419, 671, 708, 751. | Sapphire
(α-Al₂O₃, corundum) |
 |
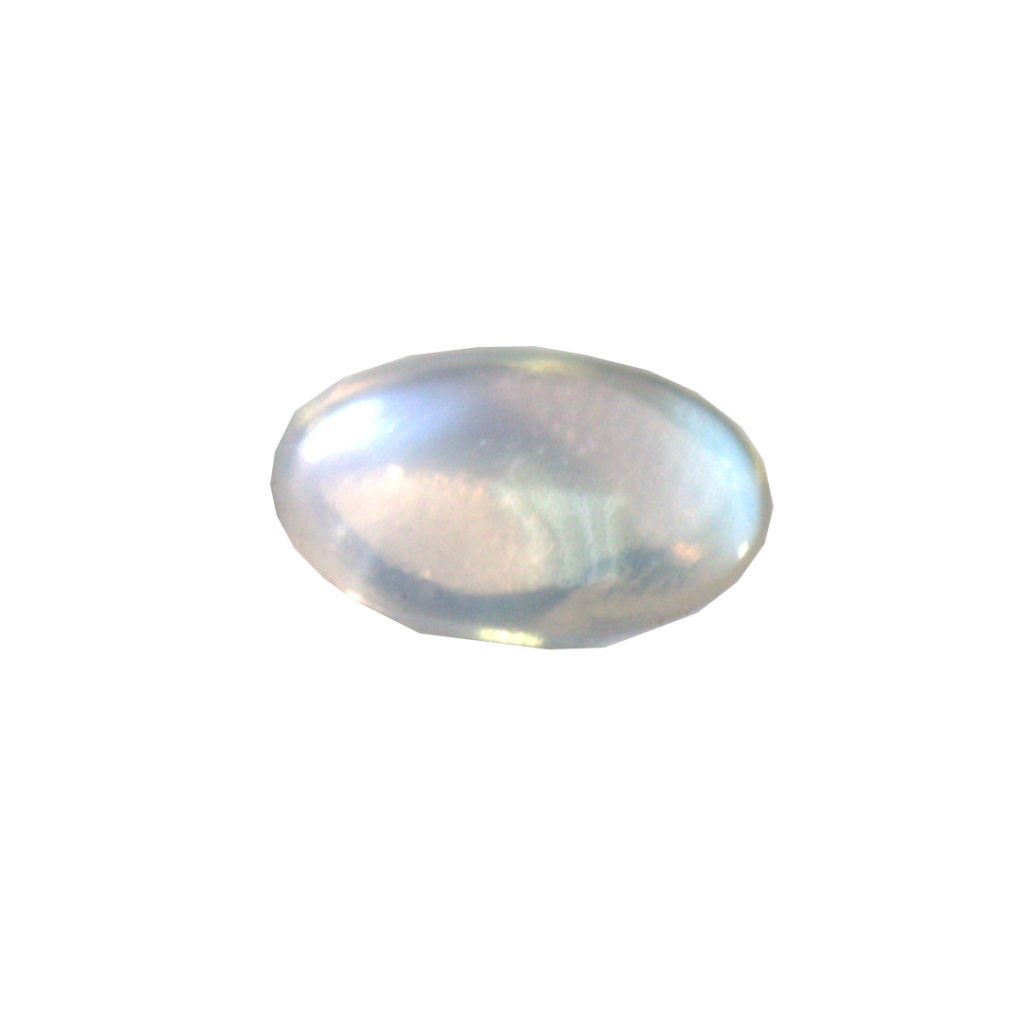 |
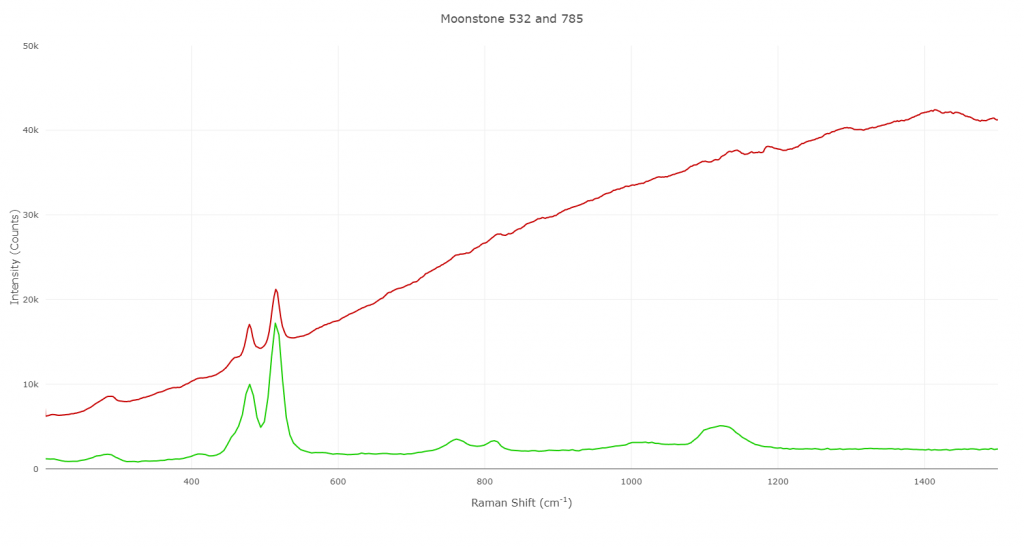
285, 479, 514, 756, 813. | Moonstone
(KAlSi₃O₈, Orthoclase) |
 |
 |
316, 408, 667, 768. | Spinel (MgAl₂O₄) | 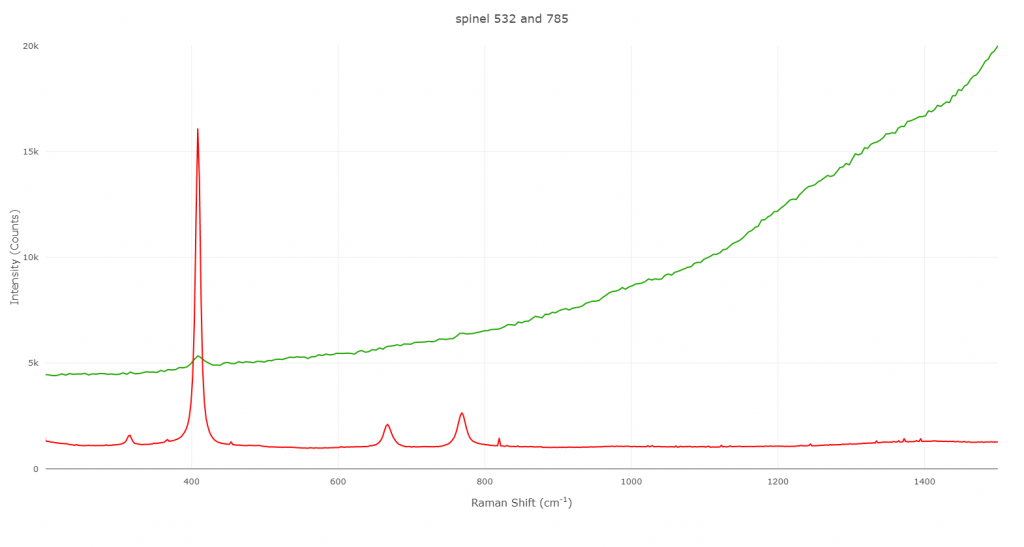 |
 |
325, 399, 685, 1014, 1072, 3605, 4096, 4157. | Heliodor (Be₃Al₂Si₆O₁₈, beryl) | 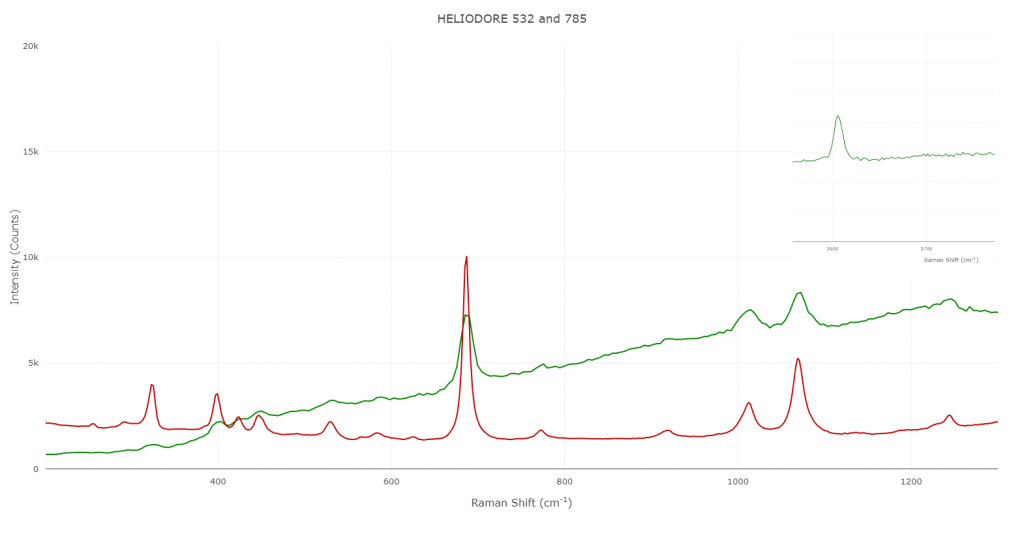 |
Dual-Laser Performance: Results and Discussion
The blind dataset confirmed that the ELODIZ NEEGALA™ workflow could identify gemstone materials through library matching, but the more important observation for this application note was the influence of excitation wavelength on spectral quality and diagnostic content. The table should therefore be viewed not only as a list of identifications, but also as a practical comparison showing how the interaction between a gemstone and the selected laser wavelength can affect the information that is recovered.
Two visually distinct samples returned the same quartz match, exhibiting identical diagnostic bands centred near ~207 cm⁻¹ and ~467 cm⁻¹ characteristic of α-quartz, consistent with amethyst and citrine being colour varieties of the same mineral species.
Peridot was identified through its characteristic olivine-related vibrational region, defined by prominent bands between ~822 and 853 cm⁻¹. Two feldspar samples, moonstone and sanidine, produced closely similar spectra, reflecting their chemical and structural relationship whilst still allowing consistent classification within the feldspar family through spectral matching.
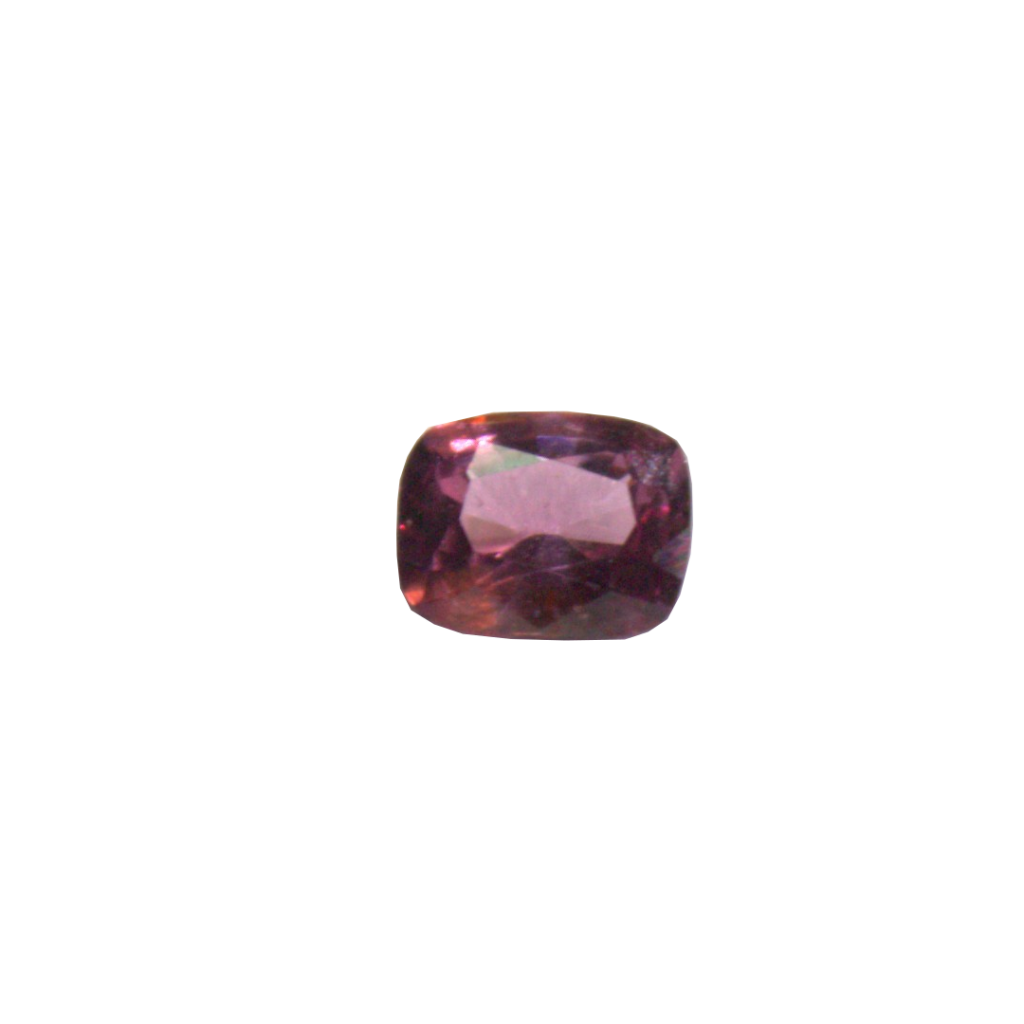
Sapphire was assigned on the basis of corundum-related modes between ~378 and 416 cm⁻¹, while spinel was differentiated by its characteristic band set spanning ~312–406 cm⁻¹. These results demonstrate the ability of Raman spectroscopy to distinguish minerals that may appear similar in colour, transparency, or conventional optical examination.
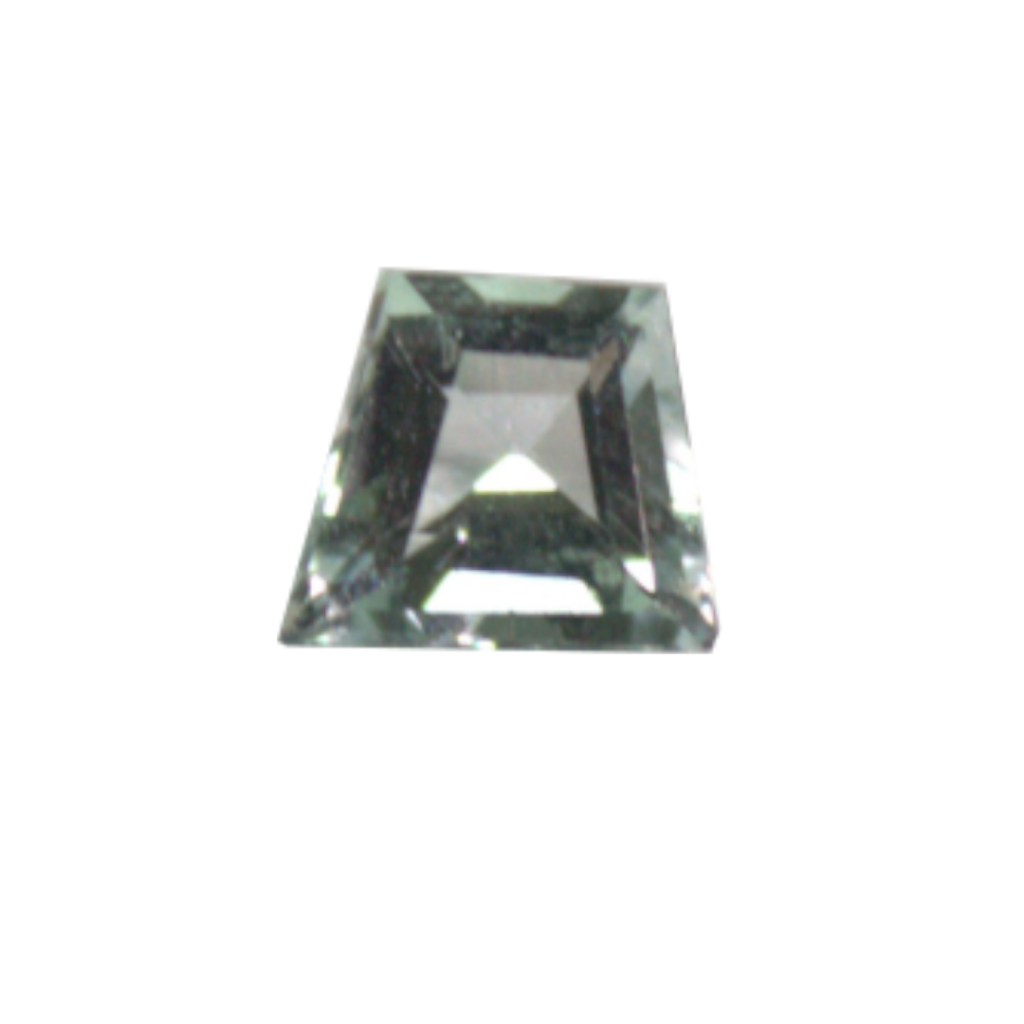
More compositionally complex materials also produced distinctive spectral signatures. Rubellite generated a characteristic tourmaline spectrum that included a notable band near 1068 cm⁻¹; under 532 nm excitation, additional bands were observed at 3472 cm⁻¹, 3586 cm⁻¹, and 3652 cm⁻¹ within the O–H stretching region. A blue specimen was identified as topaz from its multi-peak spectrum, in which strong bands near 270 cm⁻¹ and 923 cm⁻¹ were particularly diagnostic. Under 532 nm excitation, an additional band at 3646 cm⁻¹ was observed, further supporting the presence of O–H groups. Likewise, heliodor (beryl) was identified through a characteristic feature near 684 cm⁻¹ and exhibited an O–H stretching band at 3605 cm⁻¹ under 532 nm excitation, providing additional compositional information.
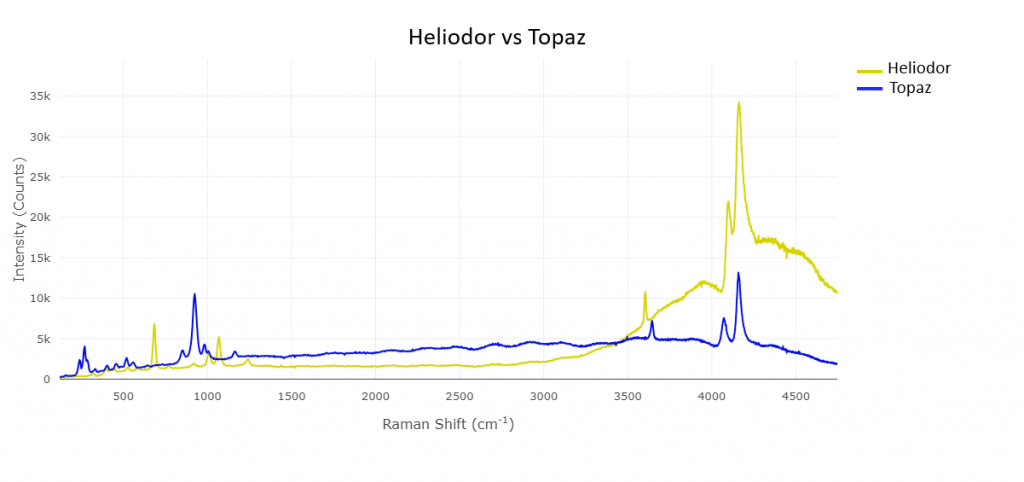
Figure 5: Spectra of Heliodor and Topaz
Although all samples produced identifiable Raman spectra, the quality of the data was not uniform across wavelengths. In some cases, 785 nm excitation reduced background interference and enabled straightforward interpretation, whereas in others, 532 nm excitation revealed sharper Raman features and additional diagnostic bands, including the O–H stretching signals observed in rubellite, topaz, and heliodor. These examples highlight the value of collecting spectra at both wavelengths. While many specimens could be identified using either excitation source, comparison of the 532 nm and 785 nm data provided a more complete understanding of sample composition and increased confidence in the final identification.
Beyond routine identification, the 532 nm excitation also revealed fluorescence features associated with trace impurities. The blue topaz exhibited intense fluorescence bands at approximately 4071 and 4157 cm⁻¹, consistent with chromium-related luminescence reported in the literature. Similar features were observed in the heliodor sample, although their positions shifted slightly to around 4099 and 4157 cm⁻¹, reflecting differences in the local crystal environment of the chromium ions. These observations demonstrate that fluorescence is not always detrimental to Raman analysis. Whilst excessive fluorescence can obscure Raman signals, weak impurity-related emission can provide useful complementary information, revealing trace constituents that may otherwise remain undetected.
The principal message of this study is therefore not simply that gemstones can be identified by Raman spectroscopy, but that access to both 532 nm and 785 nm excitation increases the likelihood of obtaining a spectrum that is both interpretable and information-rich. The complementary information provided by the two wavelengths can improve identification confidence, reveal additional compositional detail, and support the examination of challenging specimens encountered in routine gemmological analysis.
Conclusion
This study demonstrates that the ELODIZ NEEGALA™ system is effective for gemstone analysis, although the most significant finding was not the identification of the samples themselves, but the influence of excitation wavelength on the information that could be recovered from them. The results show that dual-wavelength Raman analysis can provide a more complete understanding of gemstone materials, as the quality and diagnostic value of the spectra varied between 532 nm and 785 nm excitation.
A common assumption in Raman spectroscopy is that longer wavelengths provide the most effective solution to fluorescence. Whilst the present study confirms that 785 nm excitation often reduced background interference and produced readily interpretable spectra, the results also demonstrate that this is not always the optimal choice. In several specimens, 532 nm excitation generated stronger Raman signals, revealed sharper spectral features, or provided access to additional diagnostic bands that were not observed under near-infrared excitation. The extended spectral range of the ELODIZ NEEGALA™ system further enhanced this capability by allowing collection beyond the conventional Raman fingerprint region. As observed in the topaz and heliodor samples, features recorded above 4000 cm⁻¹ provided additional information relating to trace impurities and local crystal chemistry. The most informative spectral conditions were therefore dependent on the individual sample rather than a single preferred wavelength.
From a practical perspective, these results highlight the value of combining 532 nm and 785 nm excitation within a single analytical workflow. The ability to compare responses from both wavelengths increases the likelihood of obtaining a spectrum with sufficient diagnostic information for confident identification and characterisation. This is particularly beneficial when examining gemstones that exhibit fluorescence, weak Raman scattering, or wavelength-dependent spectral behaviour. Future work could expand upon these findings through the inclusion of more strongly fluorescent gemstones, mounted specimens, and treated or synthetic materials.
References:
[1] Unknown (2014) GemsMap.jpg [image], Select Sri Lanka (blog), 14 August. Available at: https://blogger.googleusercontent.com/img/b/R29vZ2xl/AVvXsEgRF-fkosGqQRXuT7CeGxruHdHnTBCvP9_2Ma23qCb6C3SatzMW70qnfJp6G0RMFxEp4iMQ9nmICWVAYi7wEnroZlARbERQGoWRMRTJus3k0LFI3vIJMCiVu0jHxvG-tVPVM9FznmJ8Um4/s1600/GemsMap.jpg
[2] RRUFF Project, ‘The RRUFF Database’, RRUFF, https://www.rruff.net/. Lafuente, B., Downs, R. T., Yang, H., & Stone, N. (2015). The power of databases: the RRUFF project. Highlights in Mineralogical Crystallography, T Armbruster and R M Danisi, Eds., Berlin, Germany, W. De Gruyter, 1–30.
[3] Amanda L. Jenkins and Richard A. Larsen, ‘Gemstone Identification Using Raman Spectroscopy’, Spectroscopy, 19/4 (April 2004), pp. 20–25, https://www.researchgate.net/publication/296804964_Gemstone_Identification_Using_Raman_Spectroscopy
[4] Bersani, D., Lottici, P.P. Applications of Raman spectroscopy to gemology. Anal Bioanal Chem 397, 2631–2646 (2010). https://doi.org/10.1007/s00216-010-3700-1
[5] Culka, A., Hyršl, J. & Jehlička, J. Gem and mineral identification using GL Gem Raman and comparison with other portable instruments. Appl. Phys. A 122, 959 (2016). https://doi.org/10.1007/s00339-016-0500-2
[6] Thompson, D. B., Bayens, C. J., Morgan, M. B., Myrick, T. J., & Sims, N. E. (2017). Photoluminescence Spectra of Emeralds from Colombia, Afghanistan, and Zambia. Gems & Gemology, 53, 296–311. https://doi.org/10.5741/gems.53.3.296
[7] O’Bannon, E. F., & Williams, Q. (2019). A Cr3+ luminescence study of natural topaz Al2SiO4(F,OH)2 up to 60 GPa. American Mineralogist, 104, 1656–1662. https://doi.org/10.2138/am-2019-7079