Dual laser Raman analysis of glass
Overview
Raman spectroscopy is a powerful tool for the analysis of ceramics, glasses, pigments, dyes, gemstones, etc. which are of significant regard in art and archaeology. Specifically, the ability of Raman spectroscopy to differentiate between very similar samples.
During an assessment of a sample with Raman, one important consideration is the wavelength of the excitation source. This can be for multiple general reasons:
- Sensitive samples could be easily burnt by an NIR laser
- The expected Raman scatter is going to be very weak so the λ-4 dependence must be considered
- The sample is expected to fluoresce which will interfere with and/or mask your Raman signal.
It is also possible that samples can give different information dependant on the excitation wavelength, or there is worthwhile information within the fluorescence as well as the Raman signal that warrants investigation. Such an analysis would normally require the use of two separate Raman instruments.
Below is a case study performed on several different types of glass, showing how different glass can behave
when exposed to different excitation wavelengths, specifically 532 nm and 785 nm, using the ELODIZ NEEGALA instrument. When glass is investigated using Raman, whether to investigate the dopants used with the glass[1], or to investigate ancient glass samples[2,3], high resolution systems are used to investigate only the fingerprint region of the spectrum and ignore the photoluminescence behaviour of the glass. The devices used for this analysis are often benchtop and cannot be utilised on large samples, or samples that require in-situ measurement. Glass notoriously gives different photoluminescence when using different excitation wavelengths to generate Raman signal, the structure and intensity of which could be used to differentiate between various glass types.
The case study
We have 4 samples of architectural glass. These were created to have different properties, such as temperature, resistance to different wavelengths of light as well as resistance to physical wear. They will be differentiated here by their colour:
Analysis of the glass UV-Vis-NIR absorption
The absorption of light by the individual glass types is shown in Figure 1. What is initially notable is that the clear glass has very little absorption across the UV-Vis-NIR spectrum. The coloured glasses each have very different levels of NIR absorption, with the blue glass absorbing the most light across all wavelengths, and the bronze glass absorbing the least light across all wavelengths. The UV-Vis absorption of the coloured glasses is less simple. The blue and green glasses both absorb UV light significantly more than the bronze glass. However, in the visual region, the absorption of light by the blue and green glasses decreases, whereas the bronze glass absorption increases.
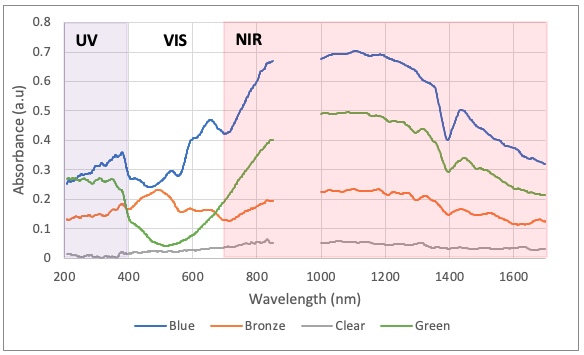
Figure 1. UV-Vis-NIR absorption data from the 4 architectural glass samples.
Analysis using the NEEGALA 532 nm Raman system
When spectra are collected using the same acquisition time (Figure 2), the bronze sample gives a much larger photoluminescence feature above 2000 cm-1. The other samples have a photoluminescence structure in the same area but the shape is different and the signal is much weaker. As the photoluminescence is weaker, the broad asymmetric Raman peaks at 580 cm-1, 785 cm-1 and 1100 cm-1 due to the silicate in the glass being no longer masked. These peaks and others in this region are commonly studied in glass analysis.
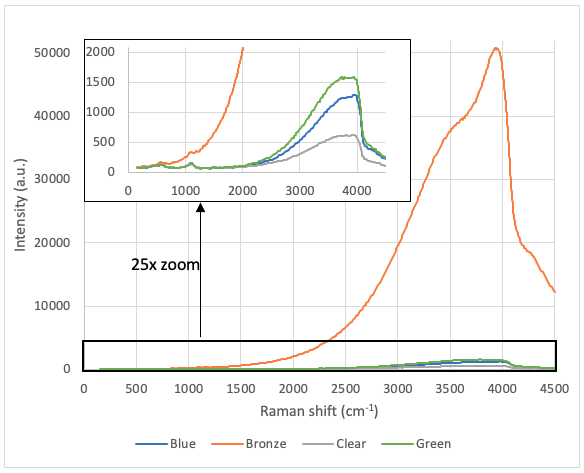
Figure 2. Raman spectra obtained using the NEEGALA 532nm excitation source, using the same acquisition time. Inset is an enhanced image of the 3 architectural glass samples with low response.
When the acquisition time is altered to achieve similar levels of signal (Figure 3), the shape of the photoluminescence structure can be seen to change between the samples. Also, in the clear sample a small broad peak can also be seen at 2400 cm-1, which is not present in the other samples.
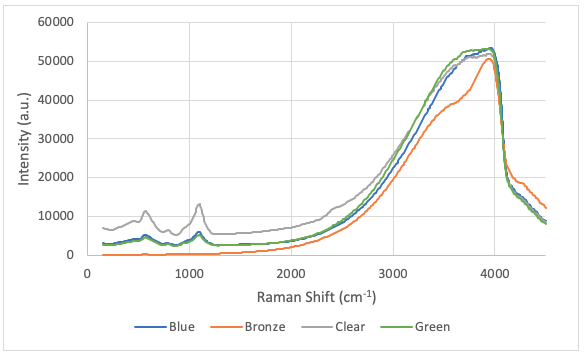
Figure 3. Raman spectra obtained using the NEEGALA 532nm excitation source, with varied acquisition times to achieve similar maximum intensities.
If we focus on that region (Figure 4), we can see that the shapes of the feature in the green and clear glass are very similar, being almost horizontally flat between 3700 cm-1 and 4000 cm-1, whereas the blue glasses feature contains a slight slope in this region. In the bronze sample there is a distinct photoluminescence peak at 3960 cm-1. If this peak is present in all samples but more responsive to irradiation in the bronze sample, the slope between 3700 cm-1 – 4000 cm-1 in the blue glass spectrum could be indicative of this peak existing and to being completely overwhelmed by the broader photoluminescence, which is present in all samples.
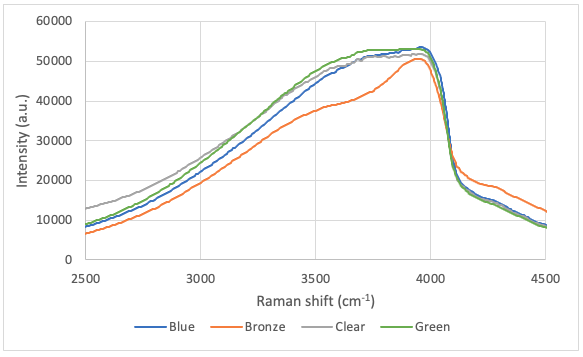
Figure 4. Enhanced view of Figure 3 to more clearly display the photoluminescence seen above 2000 cm-1
Analysis using the NEEGALA 785 nm Raman system
The spectra collected with this system are very different than the 532nm system. This highlights that some samples can have very different responses based on the wavelength of the excitation light used to induce the Raman scatter. This structure centred on 1450 cm-1, is also a photoluminescence feature.
Much like what was seen in the 532nm analysis, one sample has a much stronger signal than the others when the same acquisition time is used. However, with this system, the more intense signal comes from the clear glass, which was previously the weakest signal. The bronze sample has a significantly stronger signal than the blue and green glass samples which could allow it to be separated by this system.
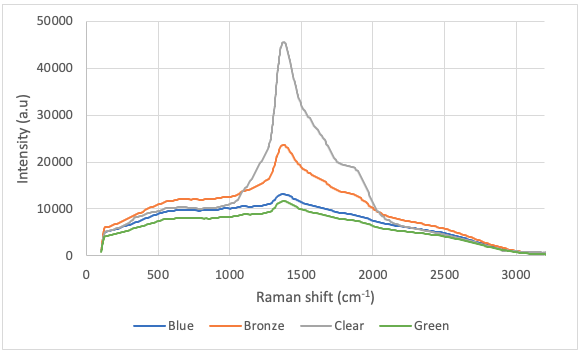
Figure 5. Raman spectra obtained using the NEEGALA 785nm excitation source, using the same acquisition time.
When the acquisition time is altered to achieve similar levels of signal, a small, broad peak is seen in the bronze, blue and green samples. This could be the silicate Raman peak at 1100 cm-1 being visible due to the muting of the photoluminescence in this region caused by the dopants in the glass.
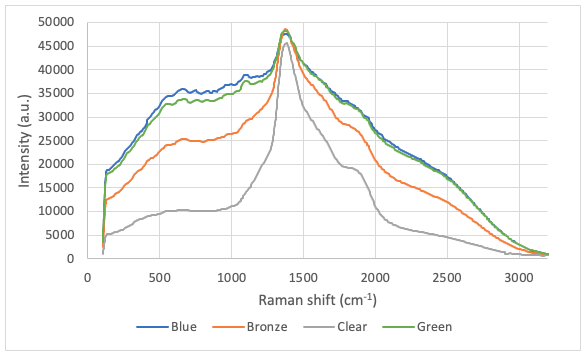
Figure 6. Raman spectra obtained using the NEEGALA 785nm excitation source, with varied acquisition times to achieve similar maximum intensities.
Conclusions
The intended purpose of these types of glass is for use in architecture. Therefore, they require properties that reduce the intensity of certain wavelengths of light, specifically UV and NIR. Assessment of the glasses using UV-Vis-NIR shows they each have strengths and weaknesses in this area. However, this assessment requires that the excitation and collection optics are on either side of the glass. This is achievable in factory during manufacture, but limits the ability of in situ measurement, especially on a large multi storey building which requires assessment or on a stained-glass window in need of conservation.
Raman spectroscopy performs both excitation and collection via the same optic, and portable Raman instruments make these in situ measurements a simple task. Analysis of the glasses using the NEEGALA 532nm Raman system showed that an intrinsic effect was enhancing the photoluminescence caused by the bronze glass. While this prevented the analysis of the silicate Raman peaks in this sample, which were observable in the other three samples, this sort of behaviour can be used to infer other chemical information about the glass. Samples which do not have this enhancement can have their Raman peaks analysed to define variations in the chemical bonding.
In the measurements obtained using the NEEGALA 785nm system, the strength of the photoluminescence feature is strongest in the clear glass which has the least absorption in the NIR region, while the blue and green glass samples give the weakest photoluminescence feature whilst having the most absorption in the NIR region. Calibration using a large volume and range of samples would allow for the correlation of the 785nm Raman spectra with the absorption properties of the glass, permitting the assessment of the glass in situ.
Final Thoughts
By combining the analysis of the glass using the 532 nm and 785 nm systems, a user can analyse the Raman information which is collectable, as well as, make an assessment of other properties of the glass, based on the varied information acquired by the two systems.
Due to the NEEGALA’s dual laser system, analysis such as this, that would normally take 2 instruments (and longer set up times to use both), can be performed using one system, on the same spot of the sample using its probe. Furthermore, the portable design of the NEEGALA allows the system to be taken to large or immovable samples for analysis in situ. The NEEGALA opens the possibility to perform a range of experiments that would call for either a visible or an NIR laser, without buying two separate systems.
For more information on our products, please contact us.
References
-
- N.A. Wójcik, S. Ali, E.I. Kamitsos, D. Möncke, Niobate in silicate and phosphate glasses: Effect of glass basicity on crucible dissolution, Int. J. Appl. Glas. Sci. (2021) ijag.16505. https://doi.org/10.1111/ijag.16505.
- S. Röhrs, G. Fenoglio, I. Reiche, L. Lambacher, Studying glass on metal: Raman analysis of medieval champlevé enamelled objects, J. Raman Spectrosc. 52 (2021) 23–34. https://doi.org/10.1002/jrs.5934.
- L. Ferri, D. Bersani, P. Colomban, P.P. Lottici, G. Simon, G. Vezzalini, Raman study of model glass with medieval compositions: artificial weathering and comparison with ancient samples, J. Raman Spectrosc. 43 (2012) 1817–1823. https://doi.org/10.1002/jrs.4103.