Calibration and Validation of Raman Instruments
What does it mean, and do I have to?
Overview
Within our series of papers on harmonisation in Raman spectroscopy, we continue to describe how the calibration and validation of Raman data is achieved.
Raman Spectroscopy is a very powerful technique for chemical identification and materials characterisation. As with any other analytical instrument, a single Raman system needs to be well calibrated so that the spectra collected can be analysed and compared with existing data, collected on another Raman system.
When discussing the way in which data is obtained, Raman shares many similarities with other spectroscopy techniques. Once the signal is obtained and filtered/manipulated (light goes through an optical elements like filters, gratings, slits, etc), the photons with the Raman signature reach the detector; readouts of the photons at the detector need to correlate with wavelength values (wavelength calibration) and the number of photons at a given wavelength should correlate with signal intensity (intensity calibration). These photons are then read and digitised, and it is at this stage that the obtained data becomes Raman data (i.e. primary data); this reading is eventually sent to a computer for processing and display of a Raman spectrum.
Further to the above, Raman data for calibration needs to be separated into two segments:
1) the x-value of the spectrum, associated with the “Raman shift“ of the signal obtained, and the “peaks” (value is in Raman shift cm-1). This data is crucial in identifying if the sample is a chemical A or a chemical B.
2) the y-value of the spectrum, associated with the intensity of the Raman signal, the peaks ratios, offset of the baseline and baseline deviation (e.g. because of the presence of residual fluorescence)
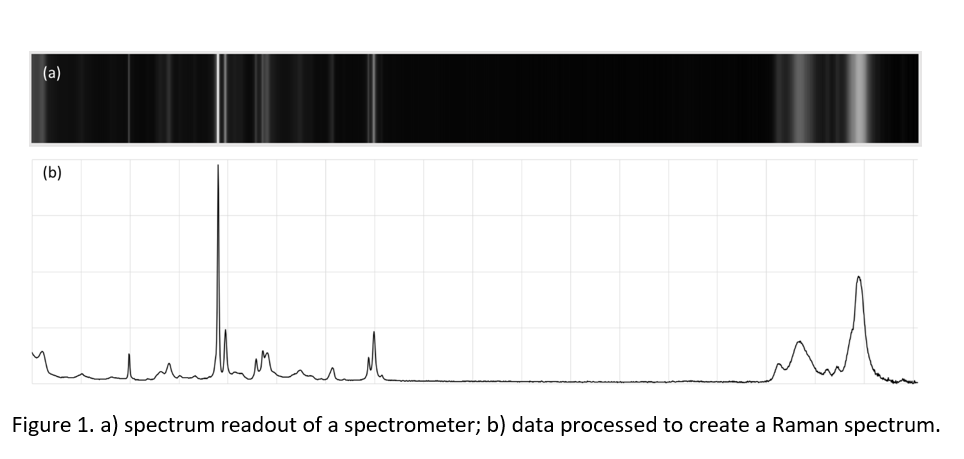
Figure 1 below, shows what the Spectrometer detector “sees” (a) and how it is transformed once data is processed (b).
x-Axis Calibration
x-axis calibration is the most important calibration to perform on a spectrometer. Without any assignment the pixels have no meaning. The x-axis uses relative units (Raman Shift) based on the laser used (used as 0 value) and the energy difference between the laser and the frequency of the electronic transition (peak). We will write a full paper on the theory of Raman Spectroscopy shortly, see the brief description in section 2 below.
When analysing a sample using Raman, the Raman shift position of a peak indicates the covalent bond it originates from. If the calibration is very poor this can lead to misidentification of the material. Also, deviation of the peak from an expected position can indicate a change in the material as a whole, such as stress or strain, or a change in the dipole moment of the covalent bond.
The calibration of the x-axis is often a two-stage process:
1) Wavelength (spectrometer) calibration
Wavelength calibration is what gives meaning to the detector image. As the light is spread across the detector, each channel/pixel only sees a very limited range of spectral light. The aim is to assign each channel/pixel a wavelength value which is the middle of range of spectral light that it sees. The most well practised and documented method of assigning wavelengths to those pixels involves shining a light with several sharp, well-known emission lines into the spectrometer, and using the peak positions to assign those pixels. After which a function can be generated to assign all the channels/pixels a wavelength value.
One source of these emission lines is a neon lamp, (available from ELODIZ, please enquire), which has several lines able to accommodate the wavelength calibration of spectrometers for Raman instruments that use the most commonly applied Raman laser lines: 532nm, 633nm & 785nm laser excitation.
2) Raman Shift calibration
Raman shift calibration is the conversion of the wavelength axis to Raman shift. The first step in Raman shift calibration is to find the precise wavelength of laser you are using. While we refer to each Raman system as a 532nm or 785nm system, this value lacks the precision needed for Raman shift calibration. If the laser wavelength is precisely known, then the wavelength axis can be converted to Raman shift using the following equation:
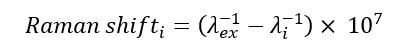
i is the channel/pixel, λex is the laser wavelength, Raman shift is in units cm-1 and wavelengths are in units nm.
If the laser wavelength is not precisely known, then a method for finding it without expensive equipment is to measure silicon. Silicon gives a very sharp peak at 520.45 cm-1, which is precisely known.1 By using the silicon peak position as a guide, then the above equation can be altered.
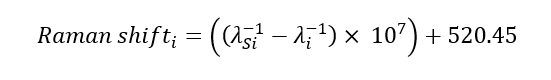
λSi is the wavelength of the silicon peak. Silicon reference samples are available from ELODIZ for this purpose and can be purchased individually or as part of our calibration kits.
If the spectrometer is perfectly aligned, designed and calibrated in this method, then you may think that your x-axis calibration is complete. This is unfortunately unlikely, however, due to the multitude of fine tuning possible with a spectrometer, and as such, it likely needs further calibration. The second step in Raman shift calibration is to find the peak positions of a Raman shift standard such as those that appear in ASTM E1840.2 These standards have multiple peaks across the range of most Raman spectrometers, and can be used to assess any deviation at different areas of the spectrum caused by components along the optical path (the optical path is the route taken by the Raman scatter from the sample to the spectrometer’s detector). Areas of, or the entire spectrum, can then be adjusted to better align with one or more of these samples’ peak positions. One of the materials that appear in ASTM E1840 is polystyrene. Polystyrene reference samples are also available from ELODIZ for this purpose and can be purchased individually or as part of our calibration kits.
y-Axis Calibration
Unlike x-axis calibration, the y-axis has intrinsic meaning without calibration. The position of a point on the y-axis can be considered proportional to the number of photons scattered or emitted from the sample. Every individual detector is unique specifically in the way in which it turns photons into electrons to register a signal. This is called the quantum efficiency and it mostly varies based on the wavelength of the photons that hit the detector. In the case of Raman this means that the relative intensities of peaks will vary drastically based upon the laser wavelength used.
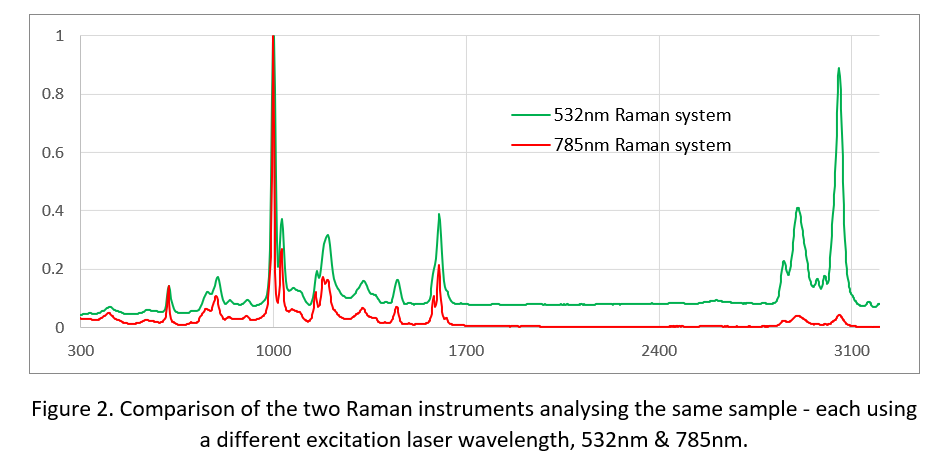
The above figure shows the variation between analysing the same samples using a 532nm and 785nm Raman system. The difference is particularly notable in the peaks at the higher end of the spectrum. While the difference between Raman systems using different wavelengths is more pronounced, as mentioned earlier, each detector is unique which leads to minor deviations in relative peak heights.
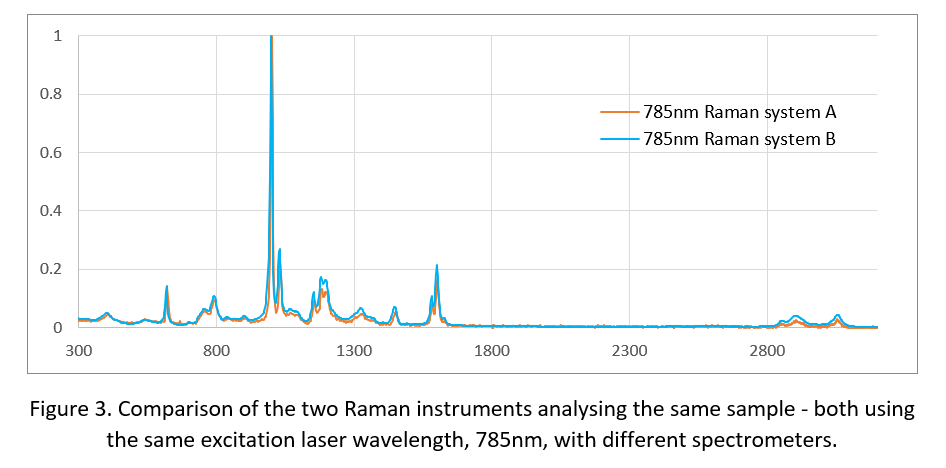
The above figure shows that there are small deviations, which become more pronounced at higher wavelengths, even though the same area on the wavelength spectrum is being used.
There are two methods for creating y-axis calibrations:
1) NIST SRM
NIST developed several fluorescent glass samples to be used for intensity calibration. The user needs to analyse the glass slide in the same way they would any other sample to generate a spectrum. This spectrum can then be compared to the certified response which is what should be generated if the detector had 100% quantum efficiency across its entire range. Then a correction function can be created to transform the measured spectrum into the certified response, which corrects the quantum efficiency curve of the detector. There are a few drawbacks to these SRMs:
a) you require one per laser line used. This is acceptable if you have one instrument, or several instruments using the same wavelength laser. However, if you have multiple laser wavelengths and multiple systems, buying all the necessary NIST SRMs can become quite costly;
b) the certification only covers a defined Raman shift range. Extrapolation of the certified response is the responsibility of the user, and its accuracy has not been confirmed;
c) there is a limited range of these SRMs. Only 488, 514.5, 532, 633, 785, 830 & 1064nm versions exist, so if a laser wavelength not on this list is used, then NIST SRMs cannot be used to calibrate the y-axis.
2) White Light Source
A white light source has a broad known emission over a wide range of wavelengths. This means they work in a very similar way to the NIST SRMs. First you take a spectrum of the light, and then with knowledge of your spectrometer’s wavelength range from the x-axis calibration, you compare the spectrum to the known emission in that range, a generate a function to resolve the difference between the two.
An advantage of a white light source is that its usefulness is defined by the range of wavelengths its emission is known for. If the emission is known from 200nm to 1100nm, then that white light source could be used to calibrate any silicon CCD based Raman spectrometer.
A disadvantage is often the lifetime. Over time the bulb will degrade, and the emission will deviate from the originally known value.
Validation Techniques
Validation is an important part of the life cycle of any Raman system. Whilst the calibrations may have been performed accurately at the time, variations can occur due to environmental factors and component aging. Analysis of known samples, such as silicon and polystyrene, can be used to indicate variations in your system’s Raman shift assignments and whether a recalibration is required.
It is also best practise to validate each optical path of your instrument independently. An optical path is the route taken of the Raman scatter from the sample to the detector. This means that if your system can change optical components such as the collection optics, fibre diameters, mirrors, pinhole, grating or slits, then you have multiple optical paths. Usually, manufacturers will only calibrate for one optical path. Validating each of these can indicate issues with alignment caused by swapping out optical components.
Finally, validation of the resolution seen by your instrument is important. It can help to diagnose if the laser has started to broaden as well as alignment issues in high end instruments caused by varying the optical path components. ASTM E252933 has an equation based on the FWHM of the 1085cm-1 calcite peak. Calcite reference samples are also available from ELODIZ for this purpose and can be purchased individually or as part of our calibration kits.
ELODIZ devices are designed with the view that calibration is a key element in developing Raman instruments for years of continuous use. Our goal is to provide all Raman users with the most accurate and reliable data experience and for this reason, all our devices are fully evaluated under the proposed guidelines of the EU H2020 Charisma Raman standardisation protocols.
For more information on our products, please contact us.
References
1. Itoh, N. & Shirono, K. Reliable estimation of Raman shift and its uncertainty for a non-doped Si substrate (NMIJ CRM 5606-a). J. Raman Spectrosc. (2020) doi:10.1002/jrs.6003.
2. ASTM International. ASTM E1840 – 96(2014) Standard Guide for Raman Shift Standards for Spectrometer Calibration. Annu. B. ASTM Stand. 03.06, 1–11 (2002).
3. ASTM International. ASTM E2529 – 06(2014) Standard Guide for Testing the Resolution of a Raman Spectrometer. Annu. B. ASTM Stand. 03.06, 1–5 (2009).